Fig. 2
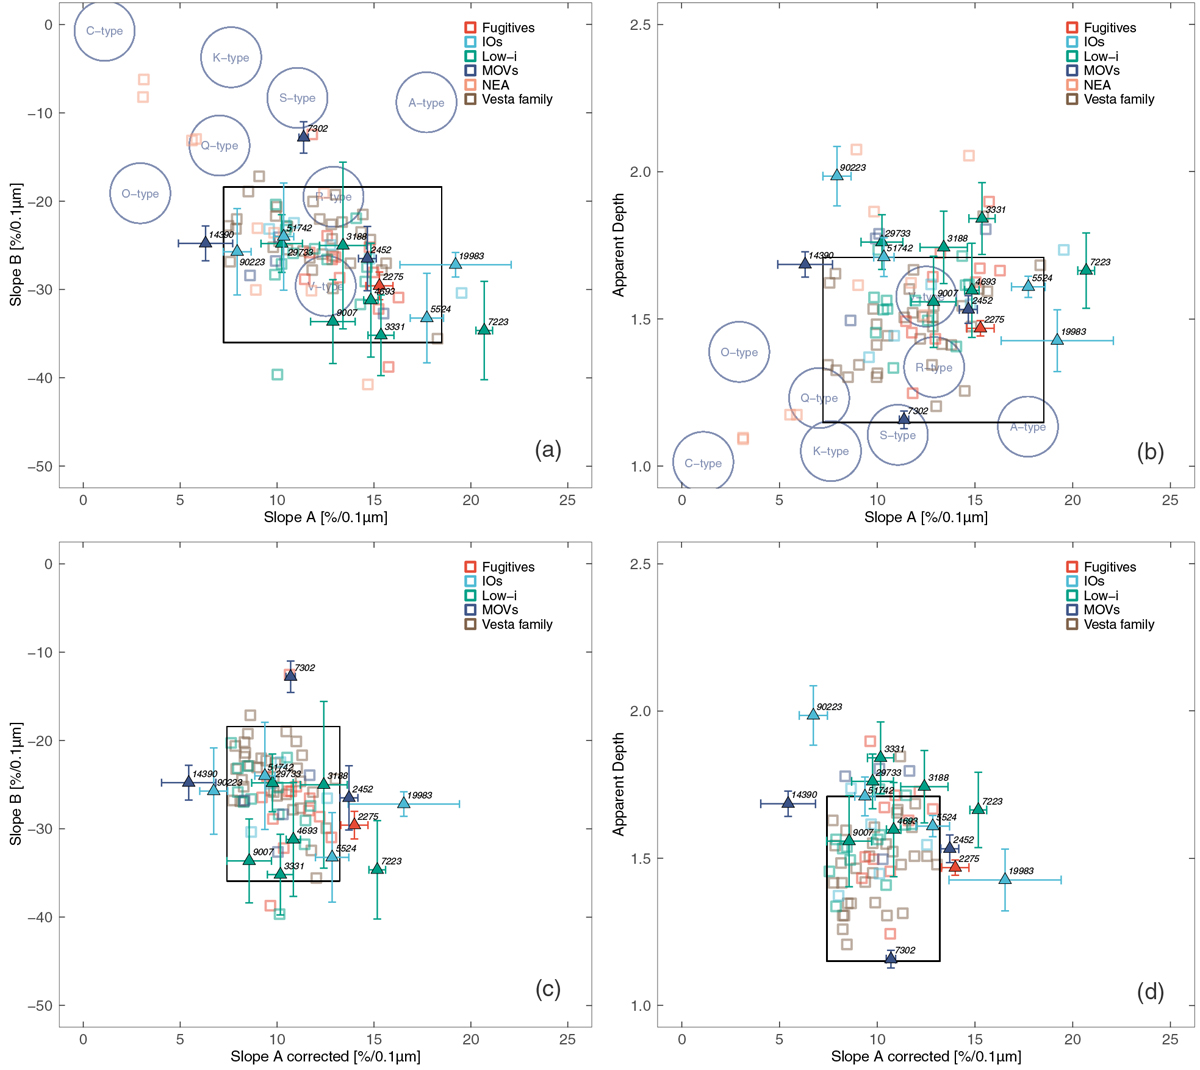
Slope A versus Slope B (a) and apparent depth (b) of the analysed V-type candidate asteroids (triangles). The same parameters are represented versus Slope A corr in (c) and (d), respectively.The studied samples are plotted along with the results from the statistical analysis of V-type asteroids by Ieva et al. (2016) (squares). The box region delimits parameters of a V-type control sample from Ieva et al. (2016). Colour coding differentiates between the dynamical groups of asteroids. Circles in the top panels represent average positions of other taxonomic types based on the mean spectra from the Bus-DeMeo catalogue (DeMeo et al. 2009), with diameter of the circle estimated from the Slope A error based on the one-sigma of the mean S-type spectrum.
Current usage metrics show cumulative count of Article Views (full-text article views including HTML views, PDF and ePub downloads, according to the available data) and Abstracts Views on Vision4Press platform.
Data correspond to usage on the plateform after 2015. The current usage metrics is available 48-96 hours after online publication and is updated daily on week days.
Initial download of the metrics may take a while.