Fig. 1
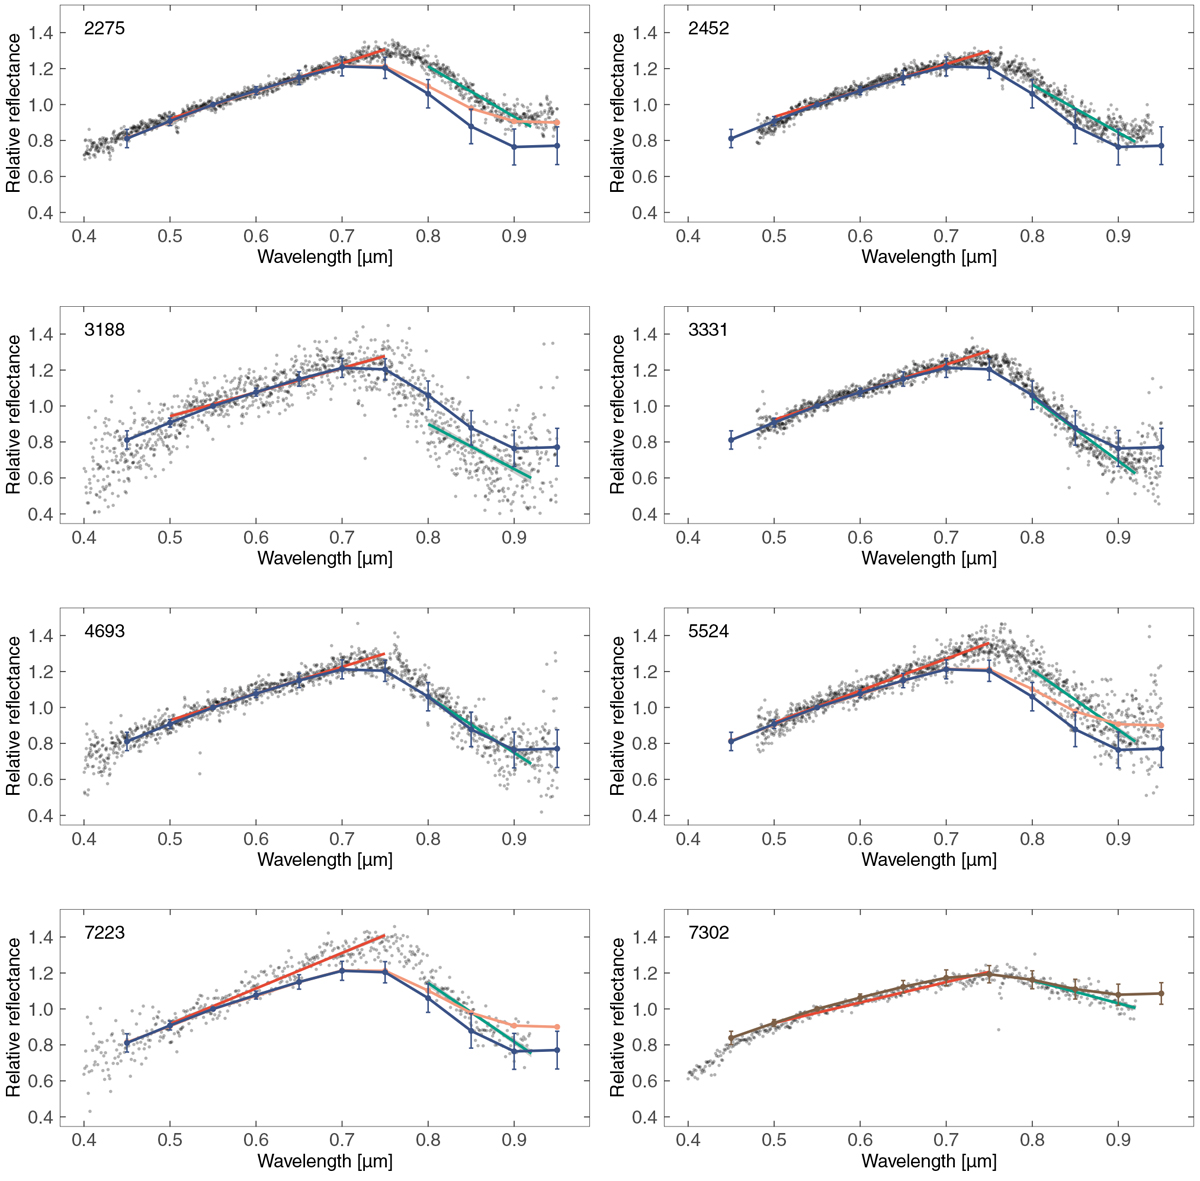
Visible spectra of studied V-type candidate asteroids (grey points). The red and green lines represent reflectance gradient fits used for the computation of the Slope A and Slope B parameters. We also plot the average spectrum corresponding to the V-type taxonomic class and its standard deviation (in blue) as defined by DeMeo et al. (2009). In some cases, average R-type (in orange) or S-type (in brown) spectrum from DeMeo et al. (2009) are also plotted for comparison.
Current usage metrics show cumulative count of Article Views (full-text article views including HTML views, PDF and ePub downloads, according to the available data) and Abstracts Views on Vision4Press platform.
Data correspond to usage on the plateform after 2015. The current usage metrics is available 48-96 hours after online publication and is updated daily on week days.
Initial download of the metrics may take a while.