Fig. A.1
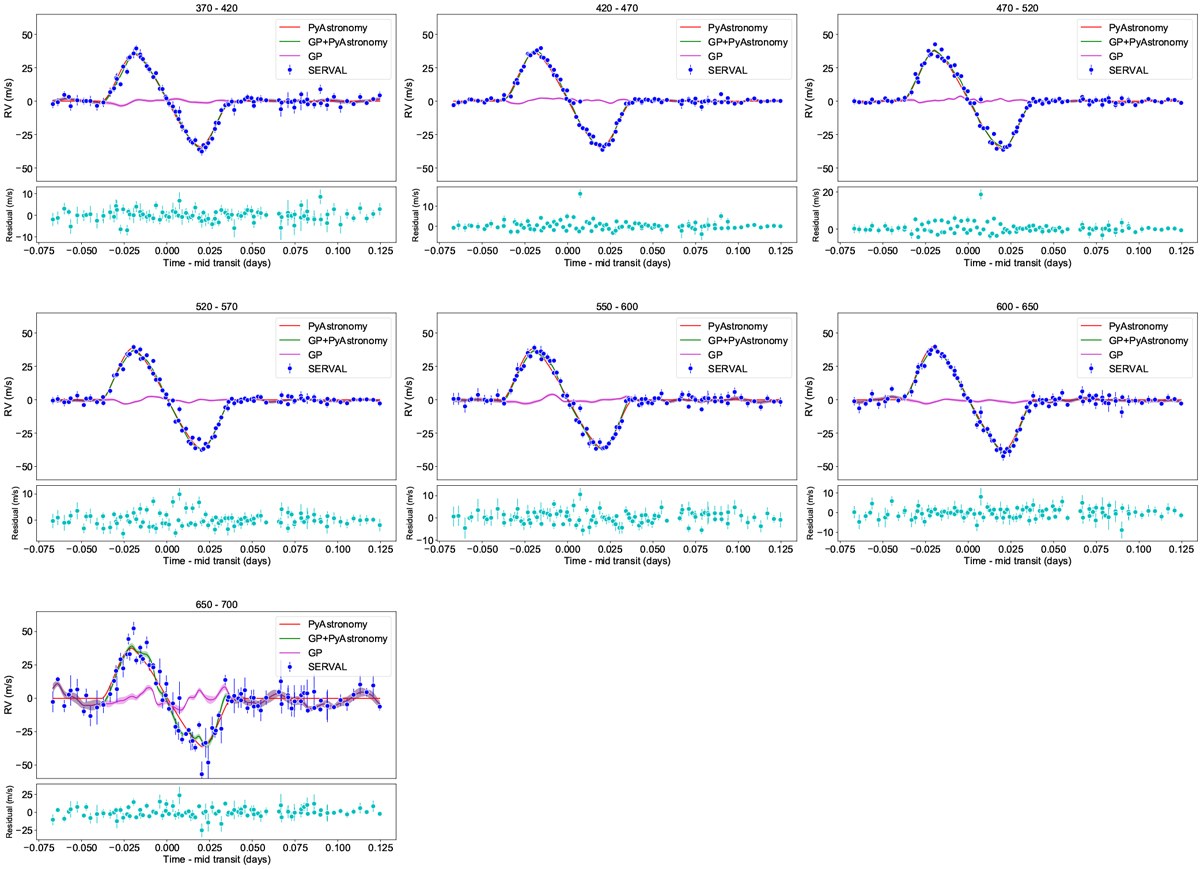
RMcurves derived with serval in different wavelength bins using HARPS observations. The out-of-transit slope has been removed for each individual wavelength bin. The best-fit model to the RM using GP+PyAstronomy models is also shown. The different components of each best-fit model are plotted in different colors and marked in the legend. The title of each panel represents its corresponding wavelength range in nm.
Current usage metrics show cumulative count of Article Views (full-text article views including HTML views, PDF and ePub downloads, according to the available data) and Abstracts Views on Vision4Press platform.
Data correspond to usage on the plateform after 2015. The current usage metrics is available 48-96 hours after online publication and is updated daily on week days.
Initial download of the metrics may take a while.