Fig. 4
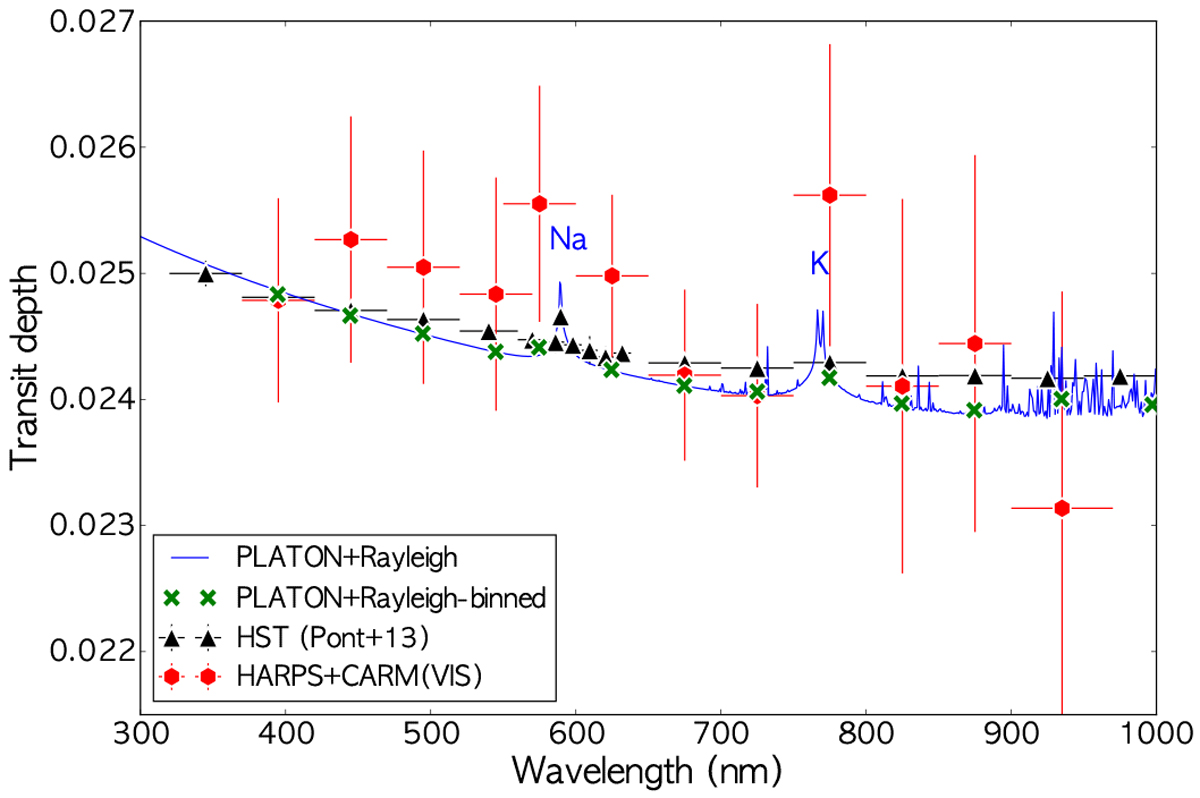
Retrieved broadband transmission spectra of HD 189733b obtained from combining HARPS and CARMENES-VIS (similar to the top panel of Fig. 3) shown as red hexagons. The values for overlapping regions between HARPS and CARMENES-VIS were obtained by averaging the two values in each wavelength bin. The solid blue line represents the forward model obtained from PLATON considering a Rayleigh slope, and green crosses show the same PLATON model that is binned in the same wavelength bins as the observed ones. For comparison purposes, we also overplot the transmission spectra of HD 189733b obtained through multiband photometric transit observation obtained with HST as black triangles (Pont et al. 2013).
Current usage metrics show cumulative count of Article Views (full-text article views including HTML views, PDF and ePub downloads, according to the available data) and Abstracts Views on Vision4Press platform.
Data correspond to usage on the plateform after 2015. The current usage metrics is available 48-96 hours after online publication and is updated daily on week days.
Initial download of the metrics may take a while.