Fig. 6.
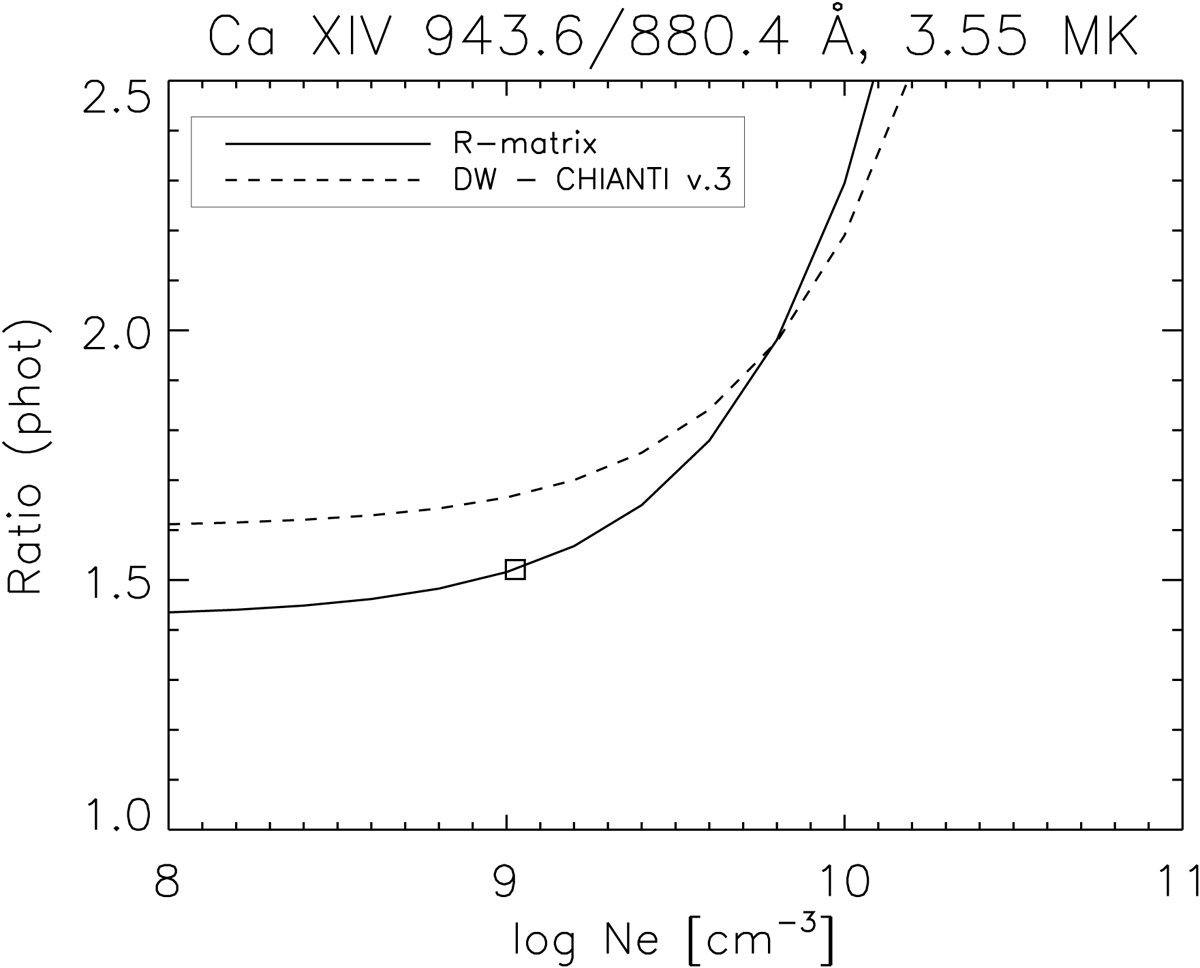
Line ratios (in phot cm−2 s−1) for key diagnostics lines of Ca XIV as a function of density at a fixed temperature of 3.55 × 10⁶ K (the peak ion abundance in ionisation equilibrium). The solid curve is calculated with the present R-matrix data, while the dashed curve use distorted wave data as incorporated in CHIANTI version 3. The square indicates the measurement from a post-flare solar SUMER observation (Landi et al. 2003).
Current usage metrics show cumulative count of Article Views (full-text article views including HTML views, PDF and ePub downloads, according to the available data) and Abstracts Views on Vision4Press platform.
Data correspond to usage on the plateform after 2015. The current usage metrics is available 48-96 hours after online publication and is updated daily on week days.
Initial download of the metrics may take a while.