Fig. 1.
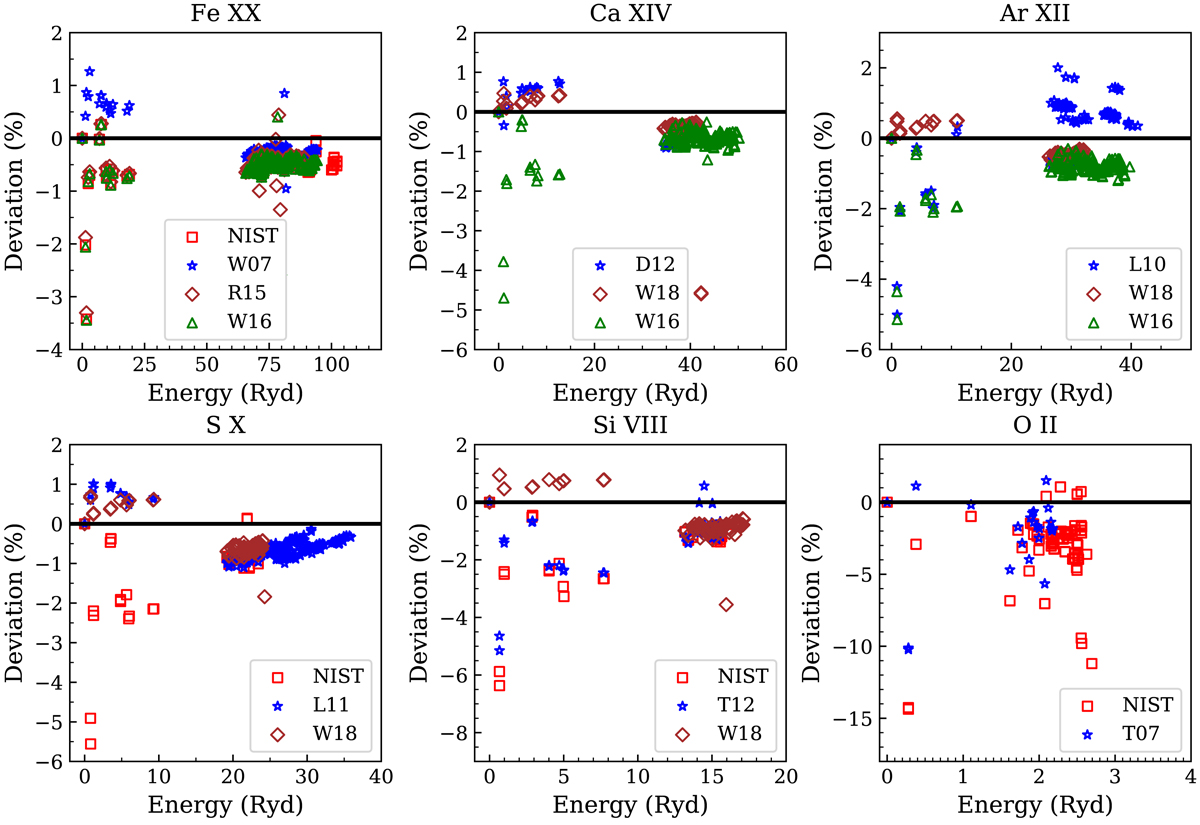
Percentage deviations between the present energy levels (horizontal lines in black), the experimental ones (NIST) and previous works: W07 refers to Witthoeft et al. (2007), R15 refers to Radžiūtė et al. (2015), W16 refers to Wang et al. (2016), D12 refers to Dong et al. (2012), W18 refers to Wang et al. (2018), L10 refers to Ludlow et al. (2010), L11 refers to Liang et al. (2011), T12 refers to Tayal (2012), and T07 refers to Tayal (2007).
Current usage metrics show cumulative count of Article Views (full-text article views including HTML views, PDF and ePub downloads, according to the available data) and Abstracts Views on Vision4Press platform.
Data correspond to usage on the plateform after 2015. The current usage metrics is available 48-96 hours after online publication and is updated daily on week days.
Initial download of the metrics may take a while.