Fig. 6.
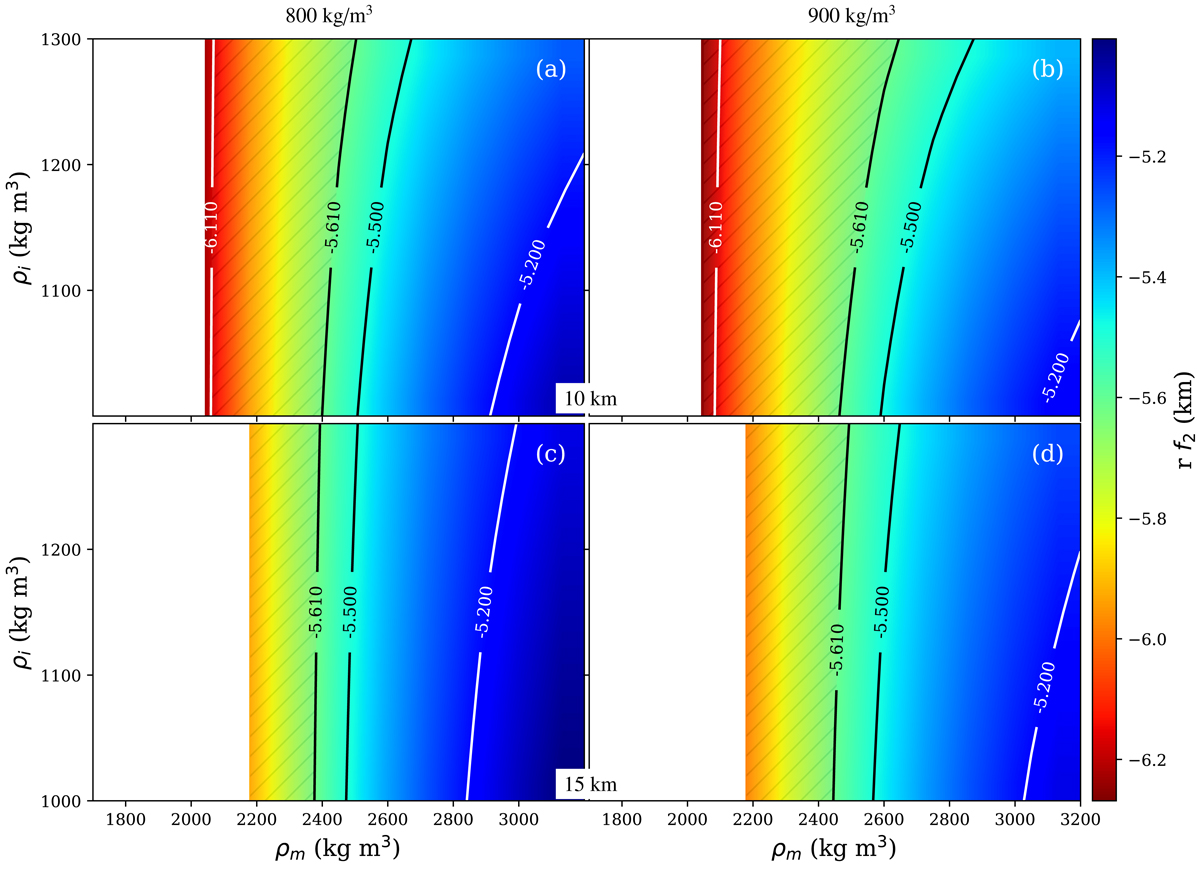
Maps of rf2 (or equivalently A2, 0) for different assumptions on Phoebe’s interior structure. Crustal density is ranged on the y-axis and the rocky mantle density is ranged on the x-axis. The observed value of A2, 0 to be matched is −6.11 ± 0.55 km and represented by the shaded bands. All cases include a rocky mantle and ice-rich layer whose densities are ranged (x- and y-axis, respectively). Models differ by the characteristics of an upper low density layer assumed as a megaregolith formed as a consequence of large impacts and long-term gardening with a density of 800 kg m−3 (right column) and 900 kg m−3 (left column) and varying thickness, from top to bottom: 10 km and 15 km. The white part are not consistent with available constraints (Phoebe’s density in particular).
Current usage metrics show cumulative count of Article Views (full-text article views including HTML views, PDF and ePub downloads, according to the available data) and Abstracts Views on Vision4Press platform.
Data correspond to usage on the plateform after 2015. The current usage metrics is available 48-96 hours after online publication and is updated daily on week days.
Initial download of the metrics may take a while.