Fig. 4.
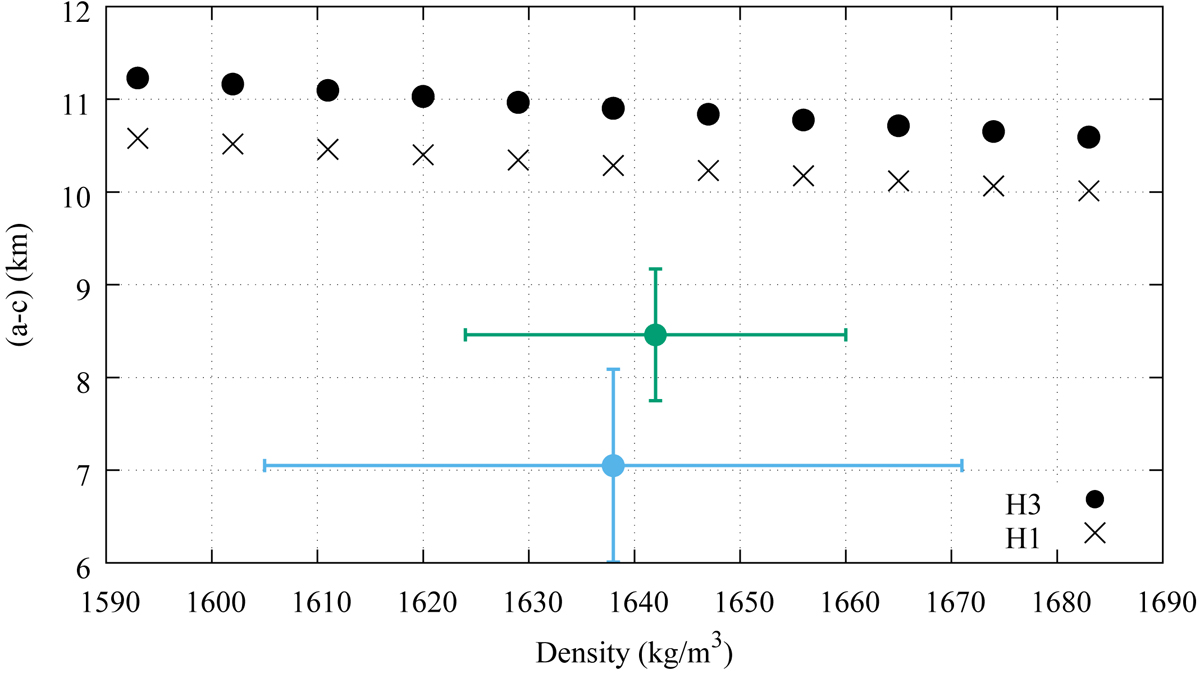
Forward modelling of Phoebe’s (a − c) radii compared against observations (blue and green error bars from Table 1) for different interior models and over Phoebe’s mean density uncertainty range. The black crosses represent the result for a homogeneous interior assuming a shape development to order 1 in small rotational parameter (similar to the case used in Castillo-Rogez et al. 2012) whereas the black-circles represent the shape obtain using the Clairaut equations developed to order 3 for homogeneous interior. The blue cross represents the values deduced from Castillo-Rogez et al. (2012) and the green one from this paper.
Current usage metrics show cumulative count of Article Views (full-text article views including HTML views, PDF and ePub downloads, according to the available data) and Abstracts Views on Vision4Press platform.
Data correspond to usage on the plateform after 2015. The current usage metrics is available 48-96 hours after online publication and is updated daily on week days.
Initial download of the metrics may take a while.