Fig. 2.
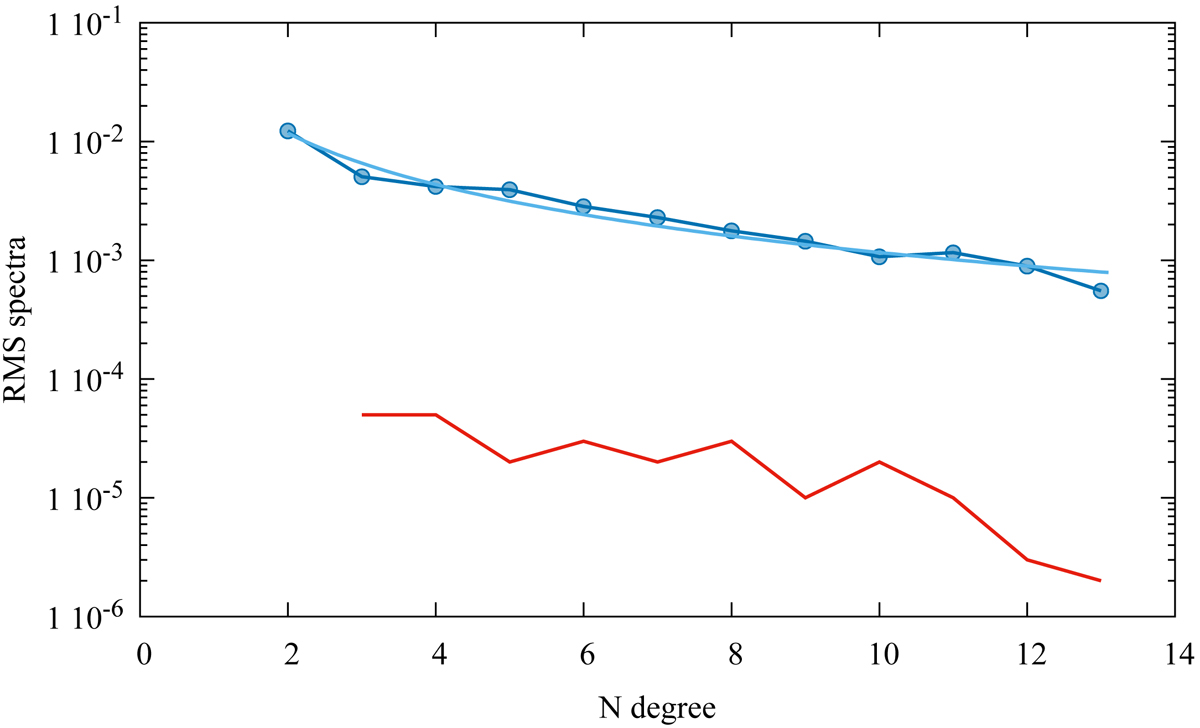
Blue dots represent the root mean square spectra for Phoebe until degree 13. The uncertainties are too low to be visible in this figure. Blue line represents the fitted Kaula’s law with a slope of −1.4. Red curve represents the difference between the RMS spectra of this paper and the values obtained in Ermakov et al. (2018).
Current usage metrics show cumulative count of Article Views (full-text article views including HTML views, PDF and ePub downloads, according to the available data) and Abstracts Views on Vision4Press platform.
Data correspond to usage on the plateform after 2015. The current usage metrics is available 48-96 hours after online publication and is updated daily on week days.
Initial download of the metrics may take a while.