Fig. 7.
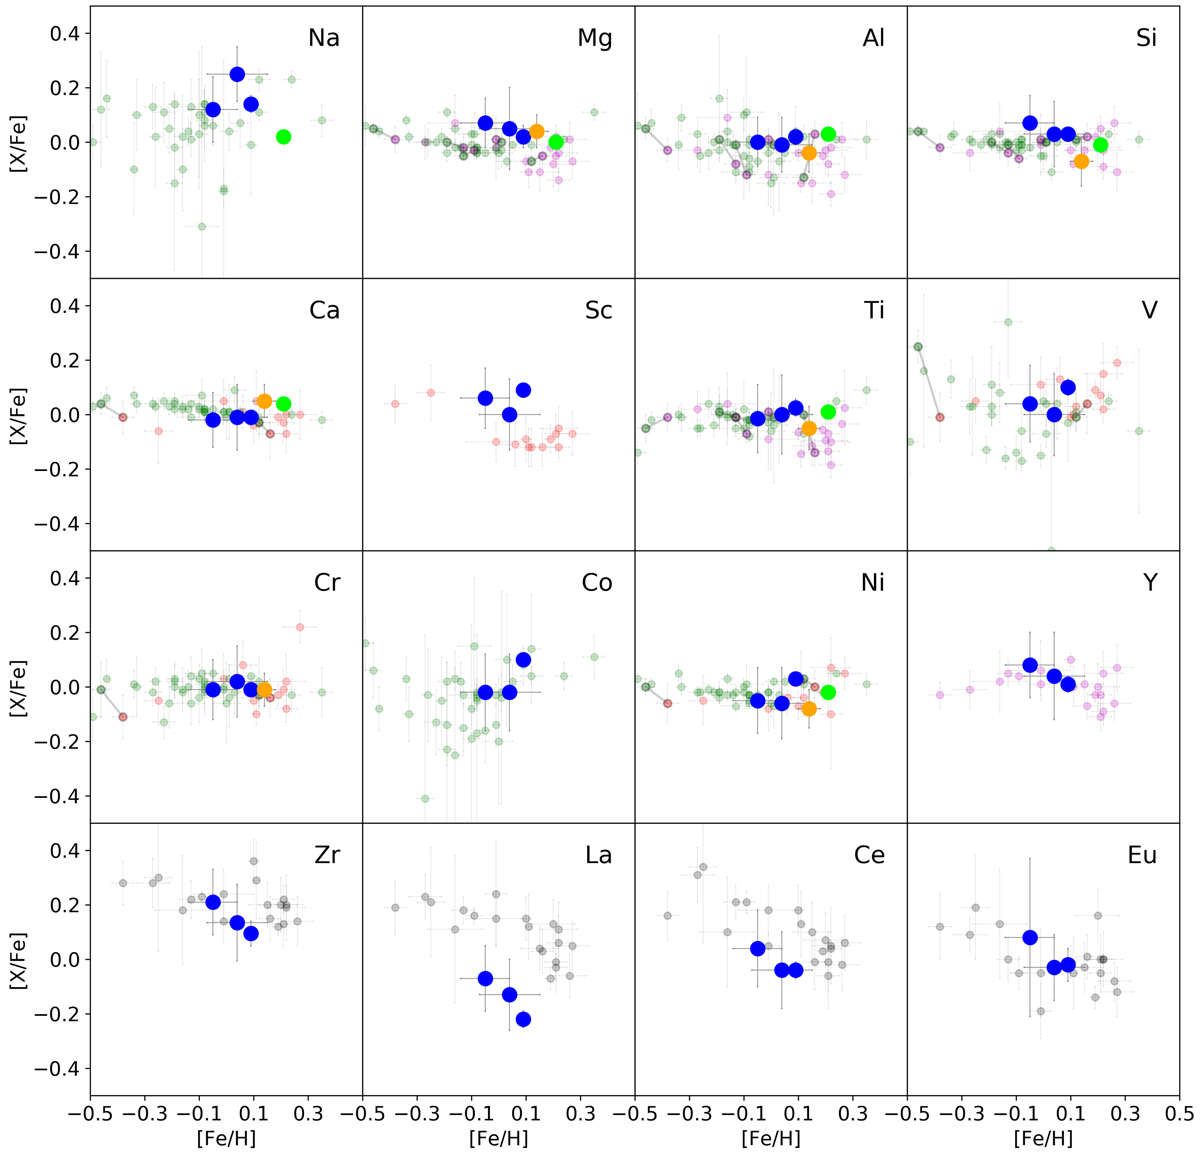
Abundance ratios vs. [Fe/H]: blue indicates our SPA clusters with [Fe/H] as an average between the two values shown in Table 6; light green indicates Praesepe; and orange indicates ASCC 123. The transparent colours indicate the following: green circles are APOGEE DR16 open clusters listed in Donor et al. (2020); red circles are the open clusters of Gaia-ESO DR4 with the [X/Fe] ratios calculated in Magrini et al. (2017); magenta circles are the open clusters of Gaia-ESO iDR5 with the [X/Fe] ratios calculated in Casali et al. (2020), not present in Magrini et al. (2017); and finally, black circles are the open clusters of Gaia-ESO iDR5 with the [X/Fe] ratios calculated in Magrini et al. (2018), not present in Magrini et al. (2017) and Casali et al. (2020). The open clusters in common between APOGEE and Gaia-ESO are linked by a black line.
Current usage metrics show cumulative count of Article Views (full-text article views including HTML views, PDF and ePub downloads, according to the available data) and Abstracts Views on Vision4Press platform.
Data correspond to usage on the plateform after 2015. The current usage metrics is available 48-96 hours after online publication and is updated daily on week days.
Initial download of the metrics may take a while.