Fig. A.3
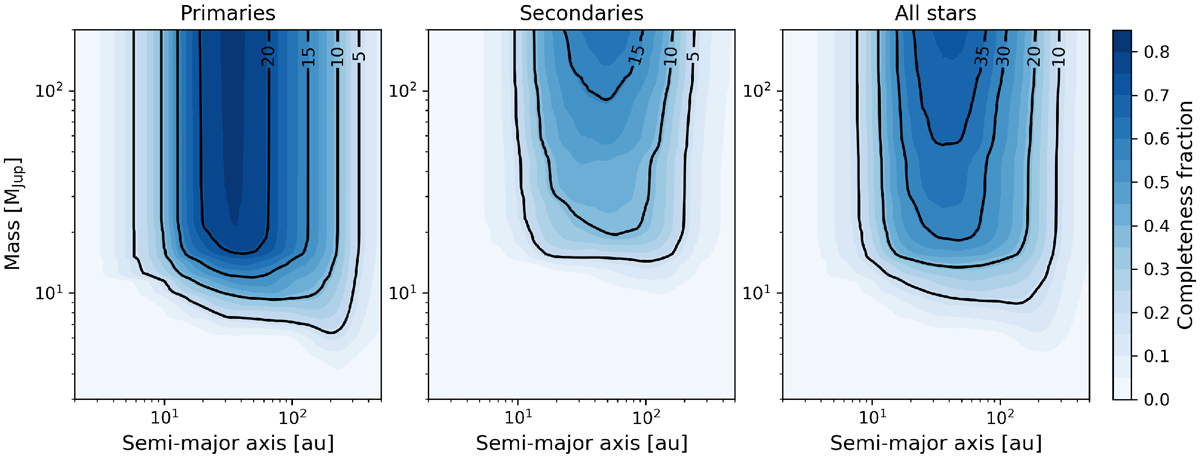
Average completeness of the survey considering the primary stars only (left panel), secondaries only (centre) and all starstogether (right). The colourmap is the same in all panels and indicates the average completeness level as a function of mass and semi-major axis for each sub-sample. The black contours show the number of stars from each subset around which companions of given masses and separations are detectable, and are therefore out of 27 stars for the left and middle panels, and out of 54 targets for the right panel.
Current usage metrics show cumulative count of Article Views (full-text article views including HTML views, PDF and ePub downloads, according to the available data) and Abstracts Views on Vision4Press platform.
Data correspond to usage on the plateform after 2015. The current usage metrics is available 48-96 hours after online publication and is updated daily on week days.
Initial download of the metrics may take a while.