Fig. 1
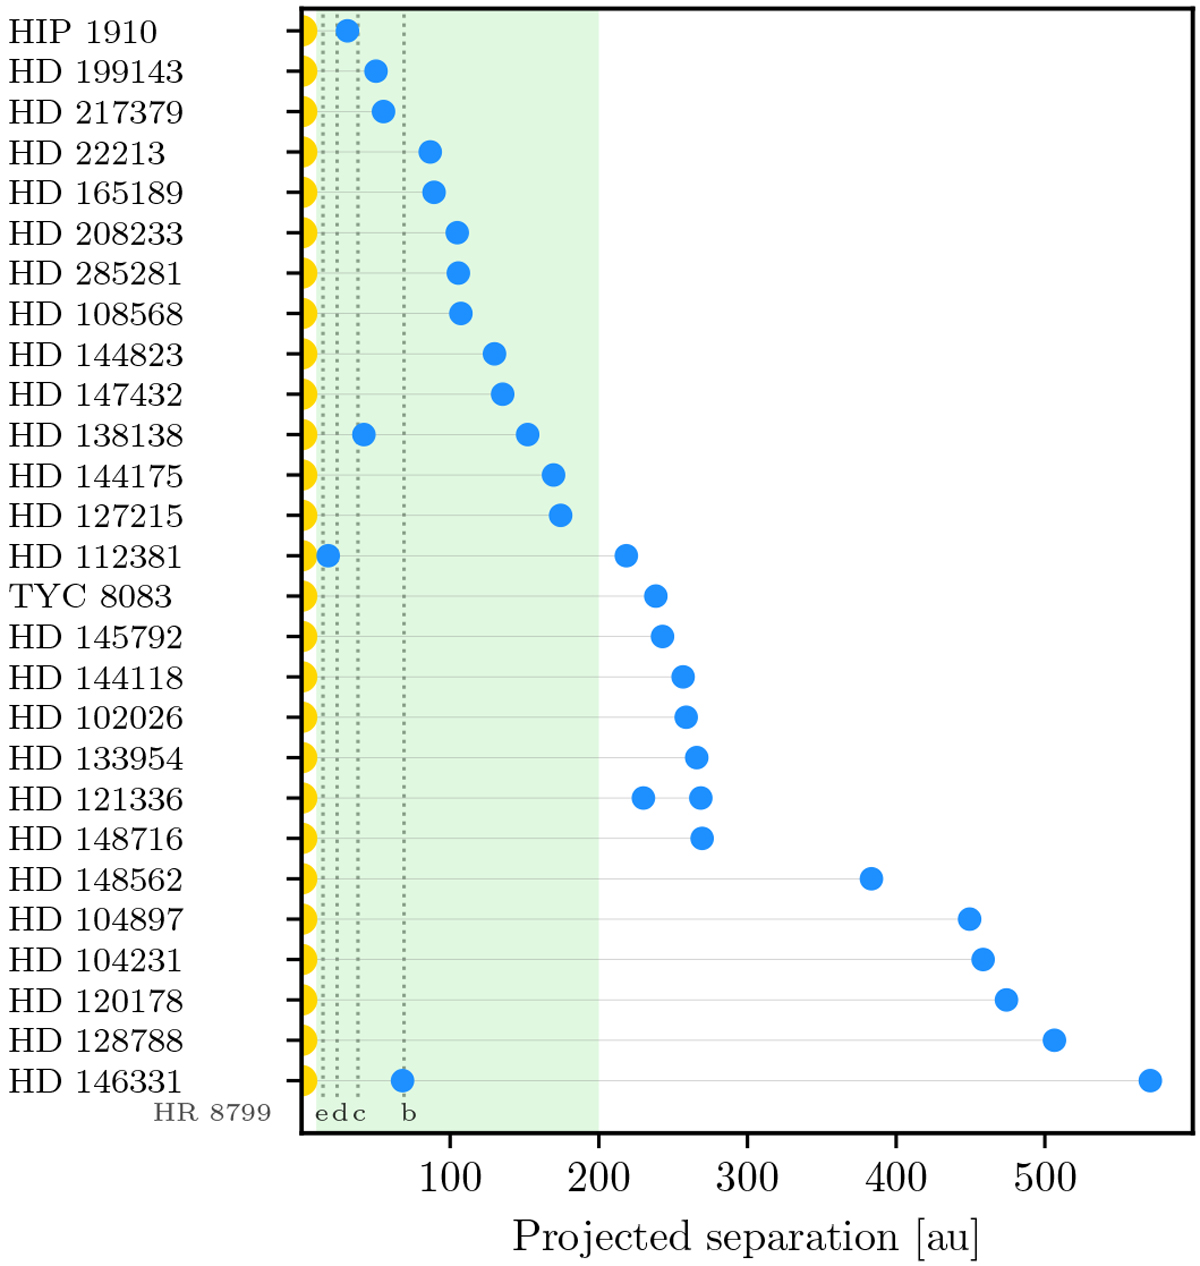
Projected separation of the binaries in the observing sample. The primary and secondary stars are represented by the yellow and blue dots respectively. The green area represents the 10–200 au considered by the statistical analysis. HR 8799 bcde are represented by vertical dotted lines to illustrate the position of this wide giant planet system.
Current usage metrics show cumulative count of Article Views (full-text article views including HTML views, PDF and ePub downloads, according to the available data) and Abstracts Views on Vision4Press platform.
Data correspond to usage on the plateform after 2015. The current usage metrics is available 48-96 hours after online publication and is updated daily on week days.
Initial download of the metrics may take a while.