Free Access
Fig. 7.
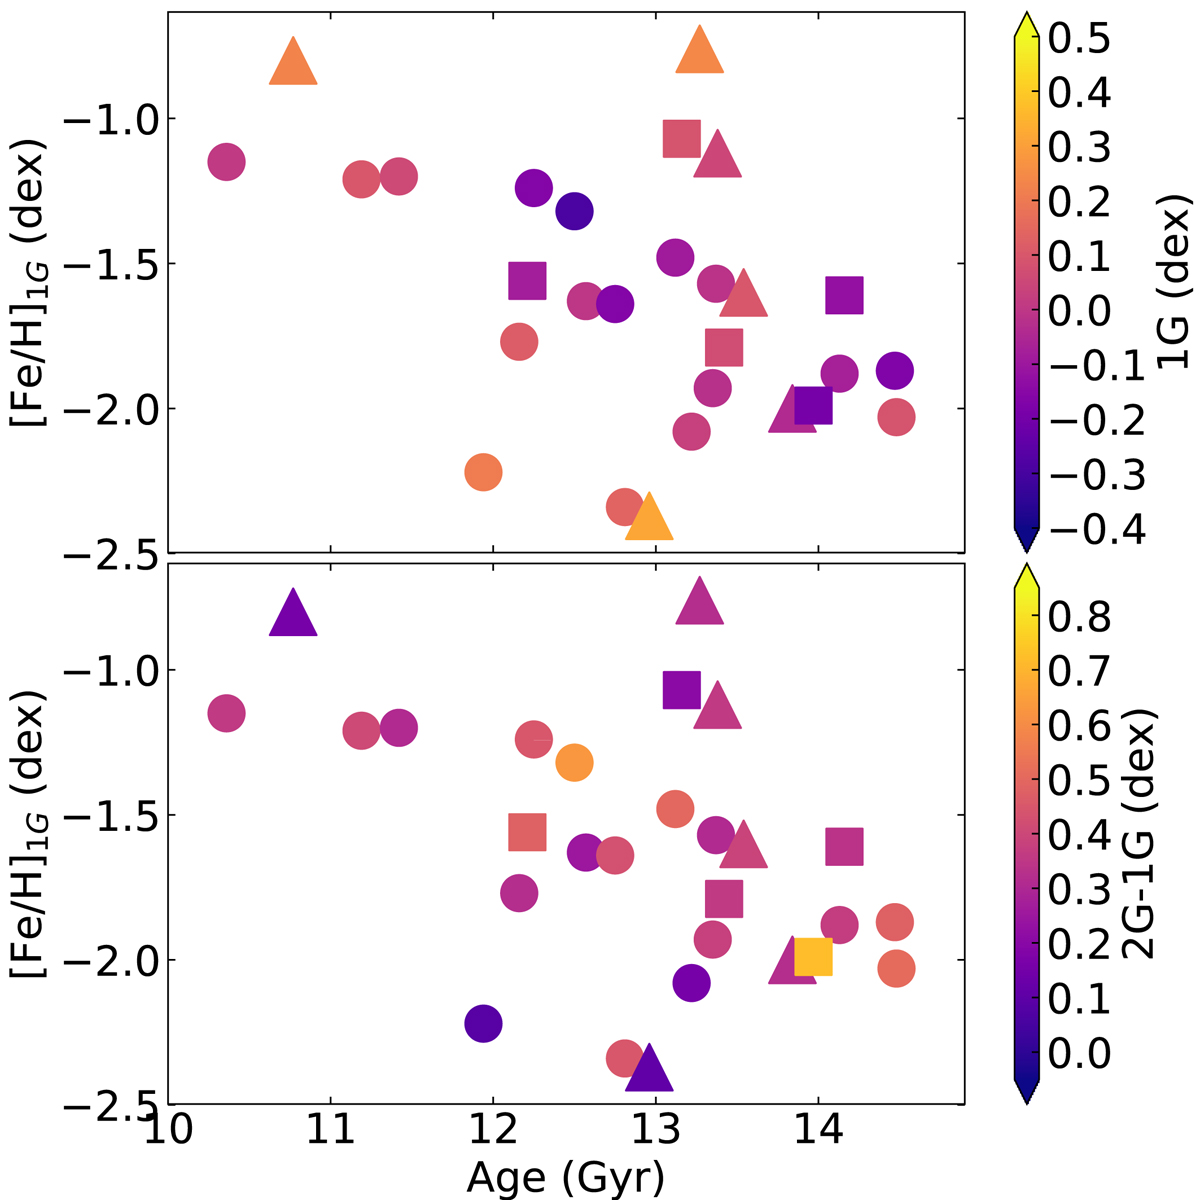
Age-metallicity relationship for the studied globular cluster sample. Filled circles, squares, and triangles represent the globular clusters associated to large and small accreted satellites and those that formed in situ, respectively. Color-coded symbols represent 1G (top panel) and 2G–1G (bottom panel) values.
Current usage metrics show cumulative count of Article Views (full-text article views including HTML views, PDF and ePub downloads, according to the available data) and Abstracts Views on Vision4Press platform.
Data correspond to usage on the plateform after 2015. The current usage metrics is available 48-96 hours after online publication and is updated daily on week days.
Initial download of the metrics may take a while.