Open Access
Fig. 5.
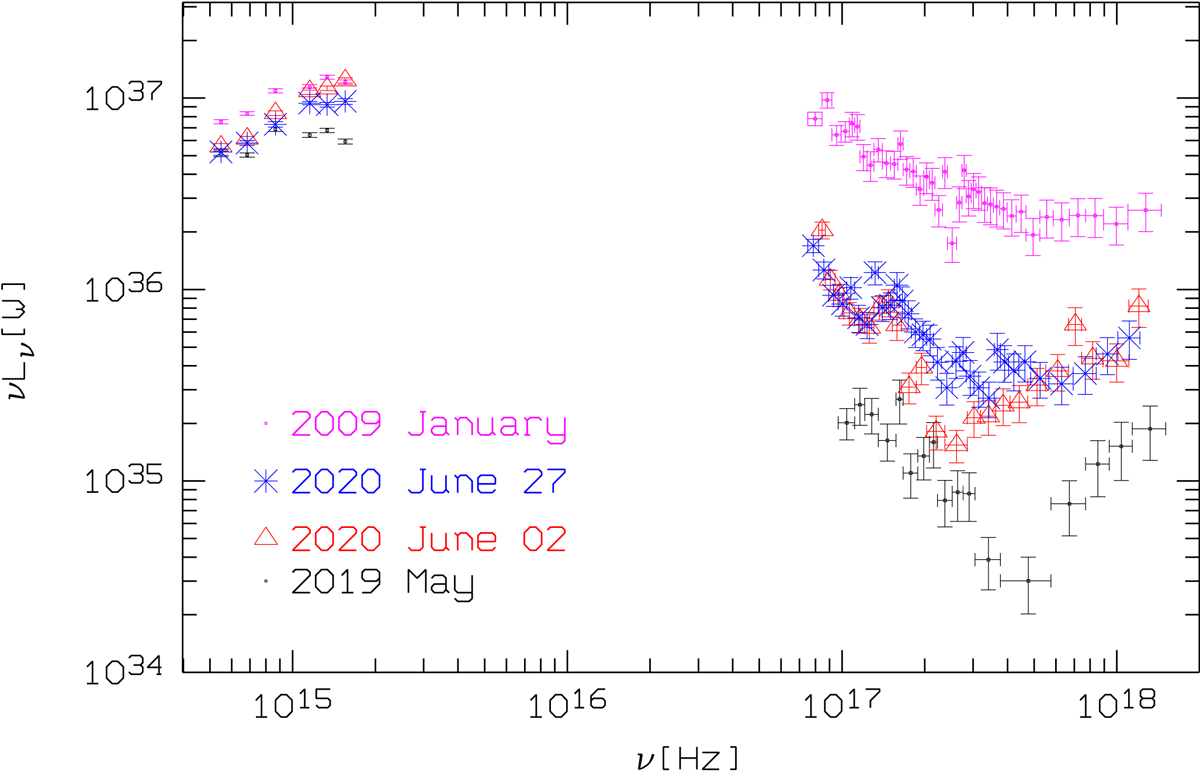
Observed Swift SED of Mrk 335 during 2020 June 2, June 27, and the deep low-state of 2019 May. Note the X-ray flux deficit around (0.7–1.2) keV on June 2. For comparison, the Swift SED during the highest X-ray state from 2009 January is shown (purple).
Current usage metrics show cumulative count of Article Views (full-text article views including HTML views, PDF and ePub downloads, according to the available data) and Abstracts Views on Vision4Press platform.
Data correspond to usage on the plateform after 2015. The current usage metrics is available 48-96 hours after online publication and is updated daily on week days.
Initial download of the metrics may take a while.