Fig. 4.
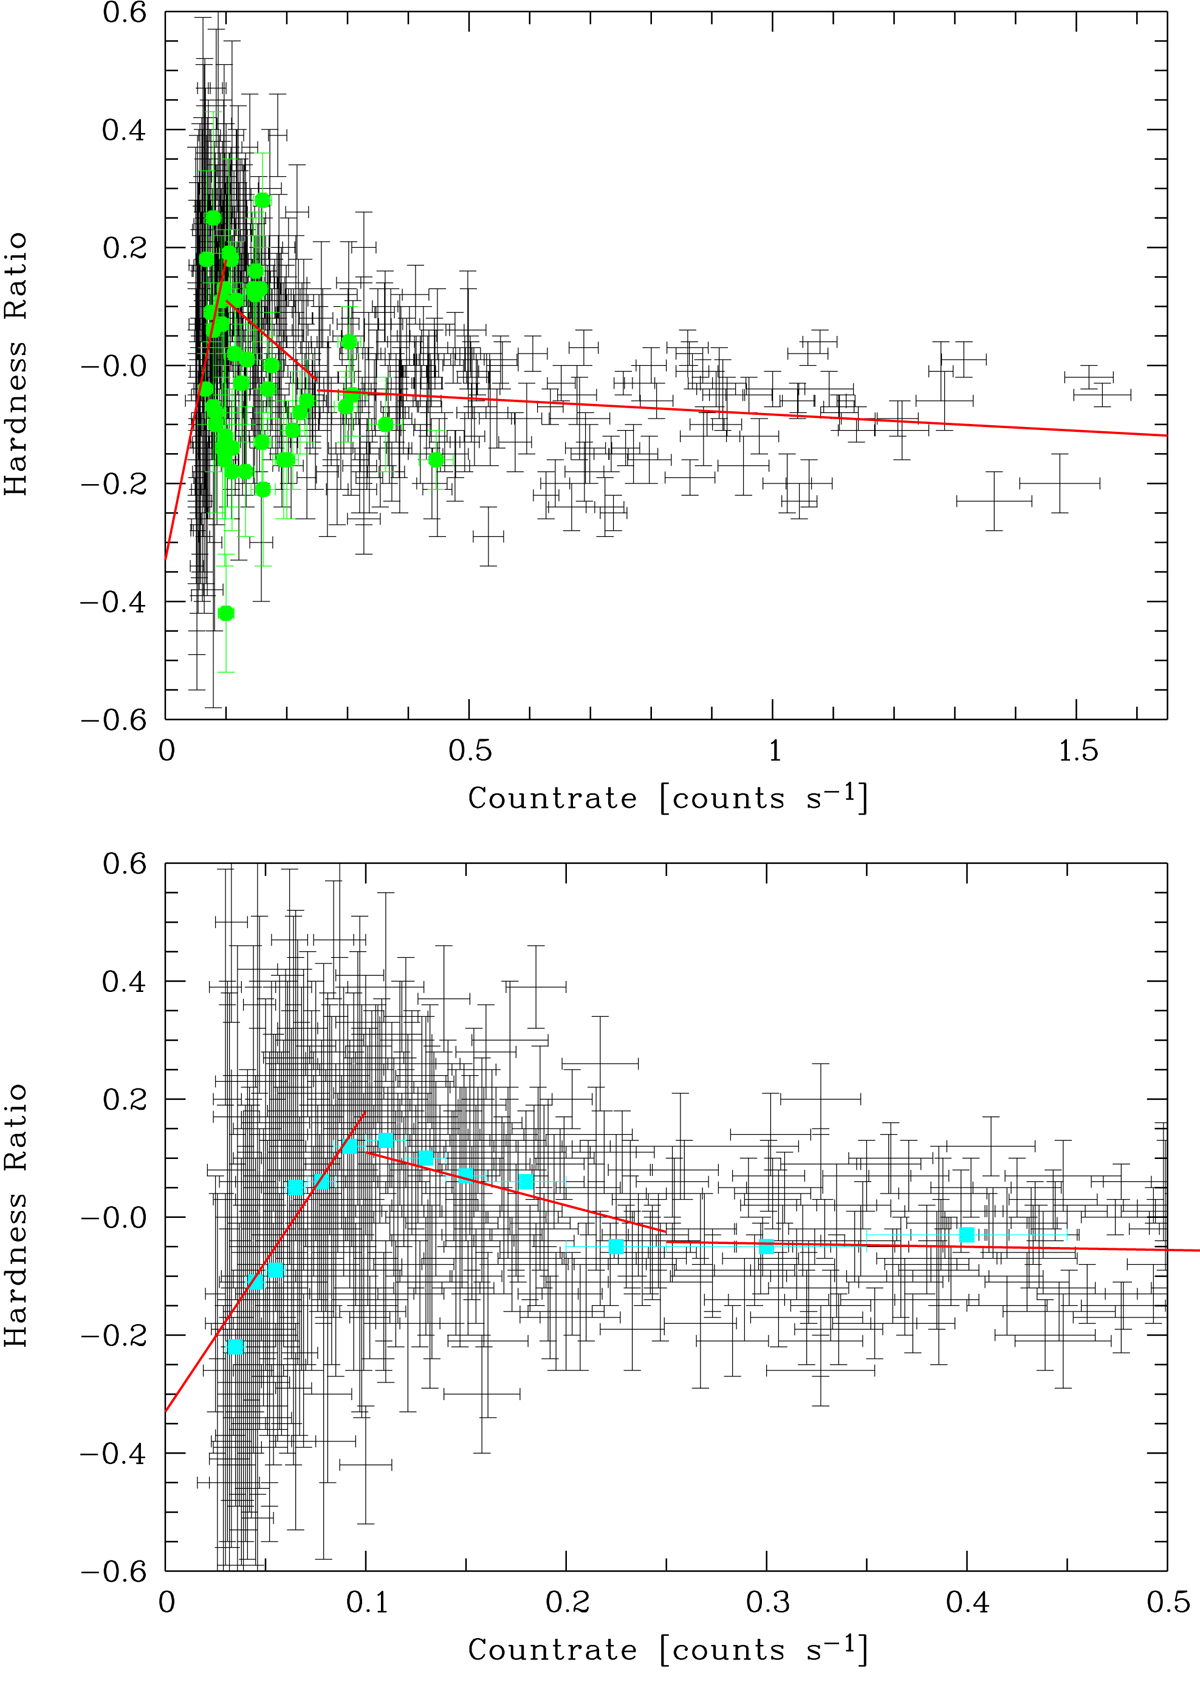
Hardness ratio vs. X-ray count rate for Swift XRT data of Mrk 335 since 2007 (black). Three regimes are apparent: a softer-when-fainter trend at lowest count rate, a softer-when-brigther pattern at intermediate count rate, and a near-constant HR at highest count rate. Upper panel: full count-rate range. Green circles represent the 2020 outbursts. Lower panel: count-rate range up to 0.5 cts s−1. The red lines represent the fits to the three regimes (Sect. 3.3), and the blue squares mark the median in each bin.
Current usage metrics show cumulative count of Article Views (full-text article views including HTML views, PDF and ePub downloads, according to the available data) and Abstracts Views on Vision4Press platform.
Data correspond to usage on the plateform after 2015. The current usage metrics is available 48-96 hours after online publication and is updated daily on week days.
Initial download of the metrics may take a while.