Fig. 2.
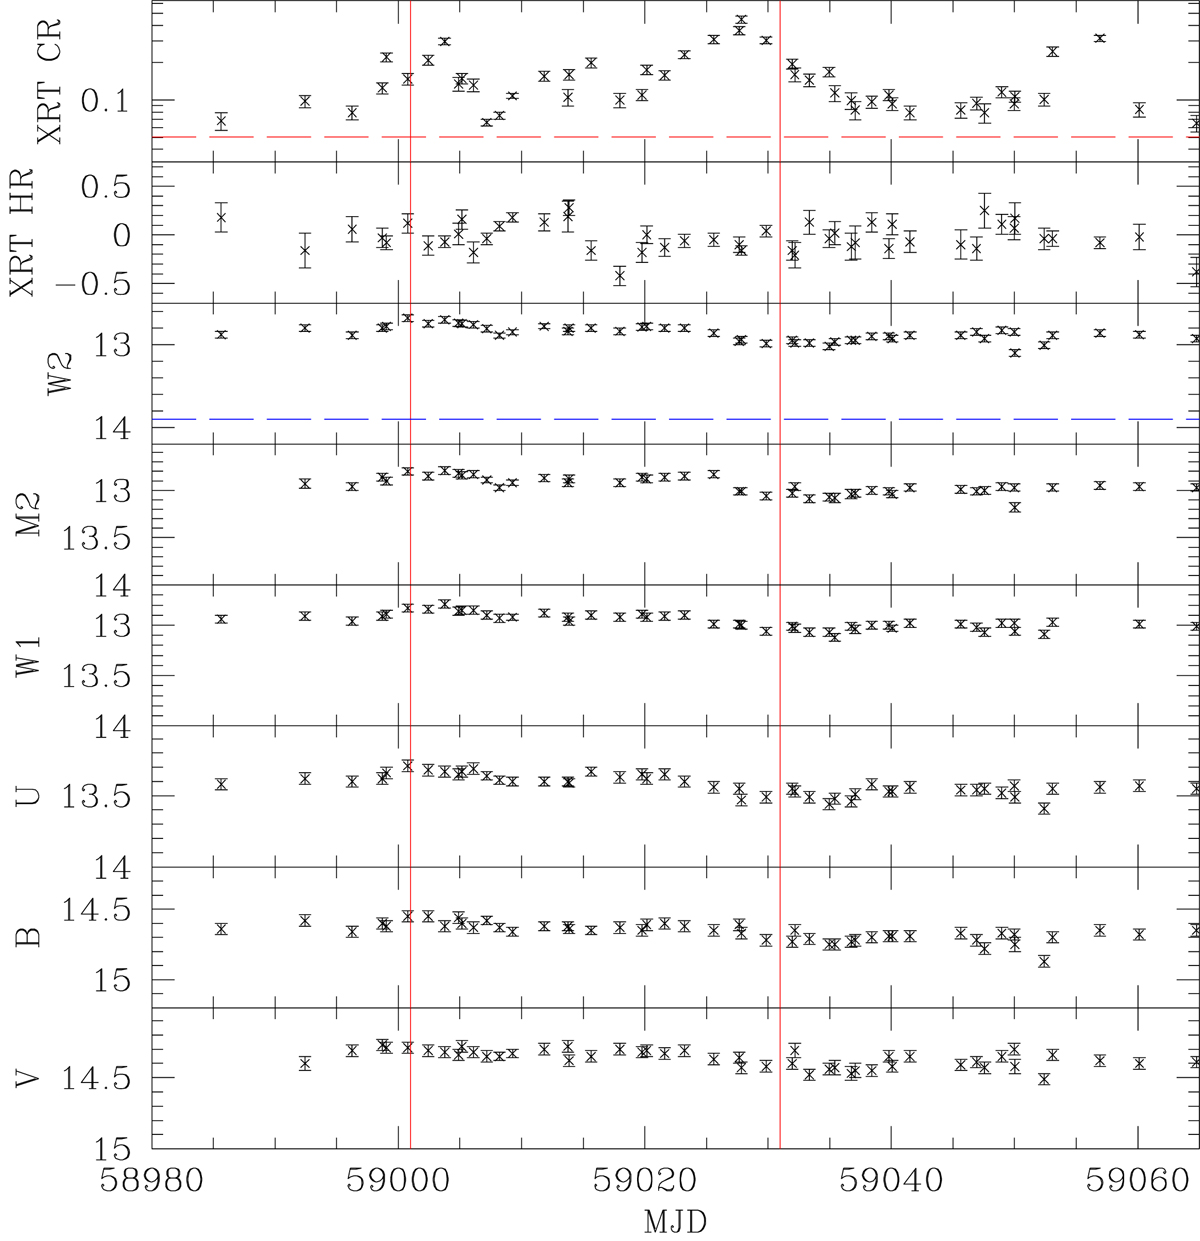
Swift outburst light curve of Mrk 335 since 2020 May 16 (units as in Fig. 1). The horizontal dashed red line marks an X-ray count rate of 0.05 cts s−1 (the lowest recorded during the 2018–2019 low state was 0.03 cts s−1), while the horizontal dashed blue line marks the lowest value of the W2 magnitude measured with Swift (in 2018). The vertical red lines mark 2020 June 1 and July 1.
Current usage metrics show cumulative count of Article Views (full-text article views including HTML views, PDF and ePub downloads, according to the available data) and Abstracts Views on Vision4Press platform.
Data correspond to usage on the plateform after 2015. The current usage metrics is available 48-96 hours after online publication and is updated daily on week days.
Initial download of the metrics may take a while.