Fig. 9.
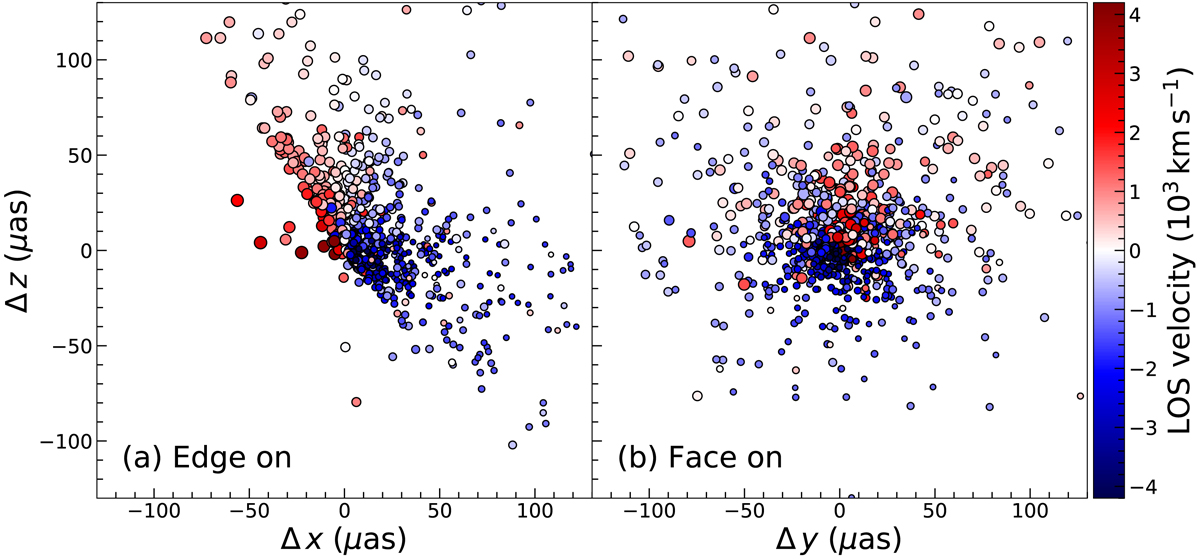
Edge-on (panel a) and face-on (panel b) views of the best-fit outflow model, except that the PA is adjusted to 180° and the BLR is moved back to the origin of the plot for clarity. In both panels, the colour coding represents the line-of-sight velocity for each cloud. Following Pancoast et al. (2014a,b), Δx is along the line of sight, Δy is the direction of the right ascension, and Δz is the direction of declination.
Current usage metrics show cumulative count of Article Views (full-text article views including HTML views, PDF and ePub downloads, according to the available data) and Abstracts Views on Vision4Press platform.
Data correspond to usage on the plateform after 2015. The current usage metrics is available 48-96 hours after online publication and is updated daily on week days.
Initial download of the metrics may take a while.