Open Access
Fig. 8.
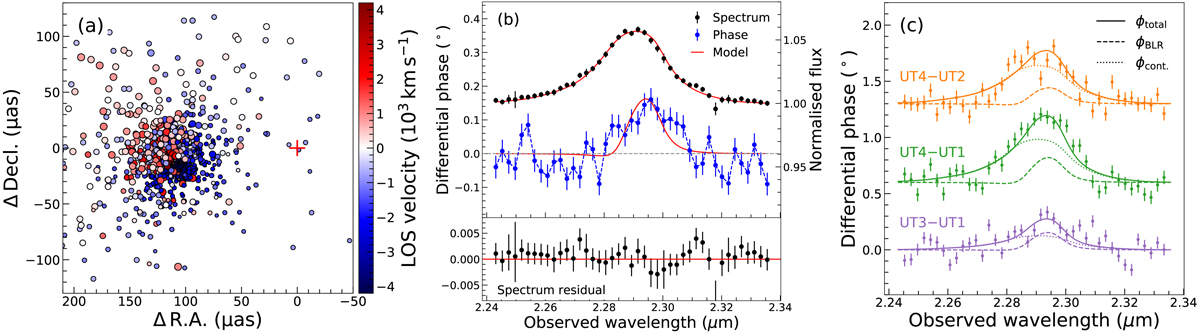
Panel a: cloud distribution of the best-fit outflow model. The symbols and lines are the same as for Fig. 7, except that in panel a the sizes of the circles scale with the weight of the cloud.
Current usage metrics show cumulative count of Article Views (full-text article views including HTML views, PDF and ePub downloads, according to the available data) and Abstracts Views on Vision4Press platform.
Data correspond to usage on the plateform after 2015. The current usage metrics is available 48-96 hours after online publication and is updated daily on week days.
Initial download of the metrics may take a while.