Fig. 7.
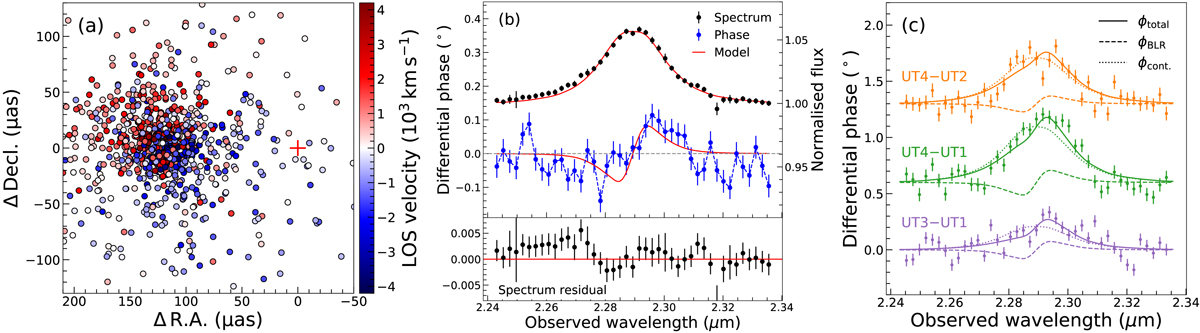
Panel a: cloud distribution of the best-fit Keplerian model. Each circle represents one cloud, colour-coded by the line-of-sight velocity. The zero velocity is defined at the best-fit λemit. The red plus sign at the origin represents the photocentre of the continuum. The orientation of the model is consistent with the observed photocentre gradient. Panel b: observed averaged differential phase from UT4−UT2, UT4−UT1, and UT3−UT1 after removing the continuum phase signal (blue) compared to the averaged differential phase from the best-fit BLR model (red). These baselines were chosen since they contain the strongest S-shape signal. Above, the observed line profile (black) is compared with the model line profile (red). The residual of the spectrum subtracting the model line profile is displayed in the lower panel. The left y axis corresponds to the averaged differential phase, while the right y axis corresponds to the line profile. Panel c: differential phase data and the best-fit models (solid lines) of the three baselines that show the strongest signal of the BLR component (dashed lines). The phase in panel b is calculated by averaging the phases of these three baselines after subtracting the best-fit continuum phases (dotted lines).
Current usage metrics show cumulative count of Article Views (full-text article views including HTML views, PDF and ePub downloads, according to the available data) and Abstracts Views on Vision4Press platform.
Data correspond to usage on the plateform after 2015. The current usage metrics is available 48-96 hours after online publication and is updated daily on week days.
Initial download of the metrics may take a while.