Fig. 6.
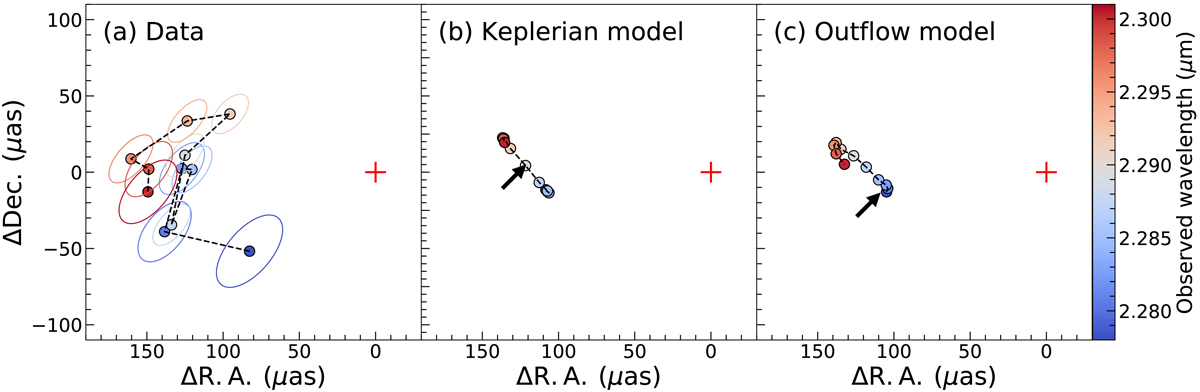
Best-fit centroids to the differential phases of (a) observed data of IRAS 09149−6206, (b) best-fit Keplerian model described in Sect. 4.2, and (c) best-fit outflow model described in Sect. 4.3. The colour code represents the wavelength of the channels around the centre of the Brγ line. The coloured ellipses around each centroid in panel a represents the 68% (1σ) credible intervals of the uncertainty. The red plus sign at the origin represents the photocentre of the continuum. The black arrows in panels b and c indicate the origin of the BLR according to the inferred offset of the models.
Current usage metrics show cumulative count of Article Views (full-text article views including HTML views, PDF and ePub downloads, according to the available data) and Abstracts Views on Vision4Press platform.
Data correspond to usage on the plateform after 2015. The current usage metrics is available 48-96 hours after online publication and is updated daily on week days.
Initial download of the metrics may take a while.