Fig. A.2.
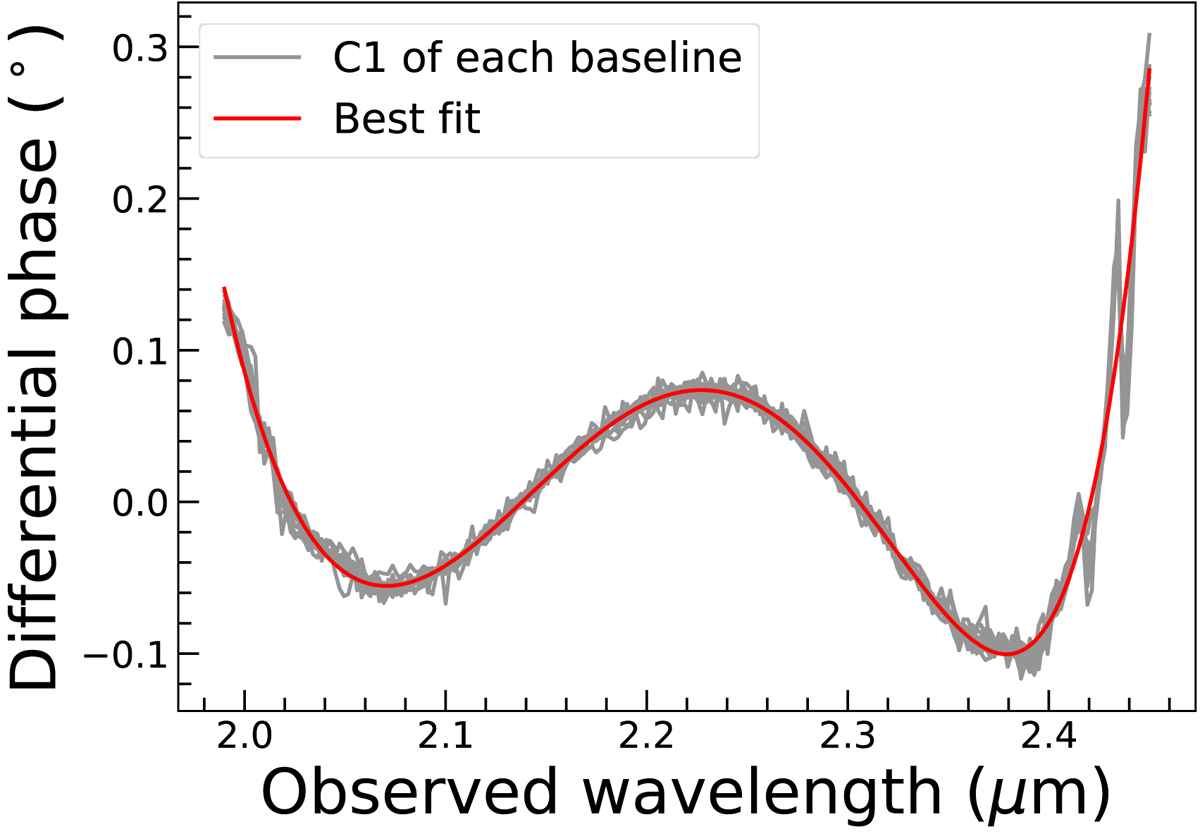
First principle components (C1) from the PCA of all of the baselines (grey curves), before and after the GRAVITY intervention, separately, are very consistent with each other. We fit them together with an eighth-order polynomial (red curve). The strong variations beyond 2.4 μm are due to the resonances of water vapour (Colavita et al. 2004).
Current usage metrics show cumulative count of Article Views (full-text article views including HTML views, PDF and ePub downloads, according to the available data) and Abstracts Views on Vision4Press platform.
Data correspond to usage on the plateform after 2015. The current usage metrics is available 48-96 hours after online publication and is updated daily on week days.
Initial download of the metrics may take a while.