Fig. 6

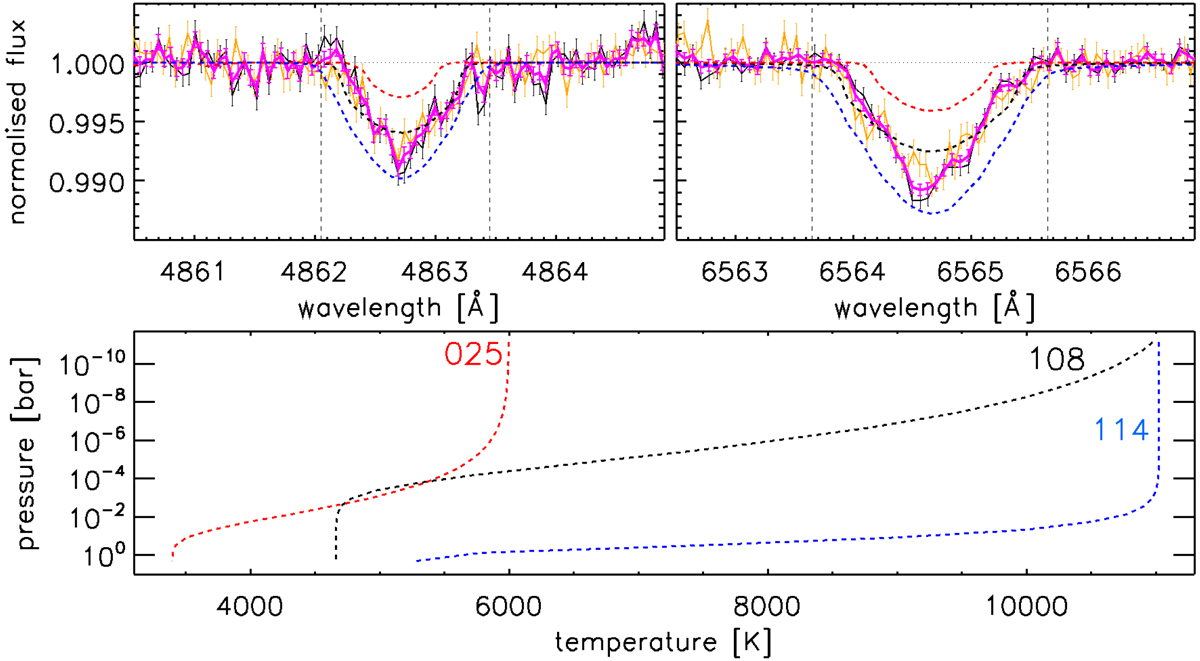
Top: same as Fig. 1, but the dashed black, red, and blue lines are the hydrogen Balmer line profiles obtained employing the TP profiles number 108, 025, and 114, respectively. The TP profile number 025 is the most similar to the PHOENIX self-consistent TP profile, the TP profile number 108 is the one leading to best fit the observed hydrogen Balmer lines, while the TP profile number 114 is the one leading to generate the strongest Balmer lines within our sample. The black, vertical dashed lines enclose the wavelength ranges considered to compute χ2 and the equivalent widths. Bottom: TP profiles corresponding to the 108 (black), 025 (red), and 114 (blue) model numbers.
Current usage metrics show cumulative count of Article Views (full-text article views including HTML views, PDF and ePub downloads, according to the available data) and Abstracts Views on Vision4Press platform.
Data correspond to usage on the plateform after 2015. The current usage metrics is available 48-96 hours after online publication and is updated daily on week days.
Initial download of the metrics may take a while.


