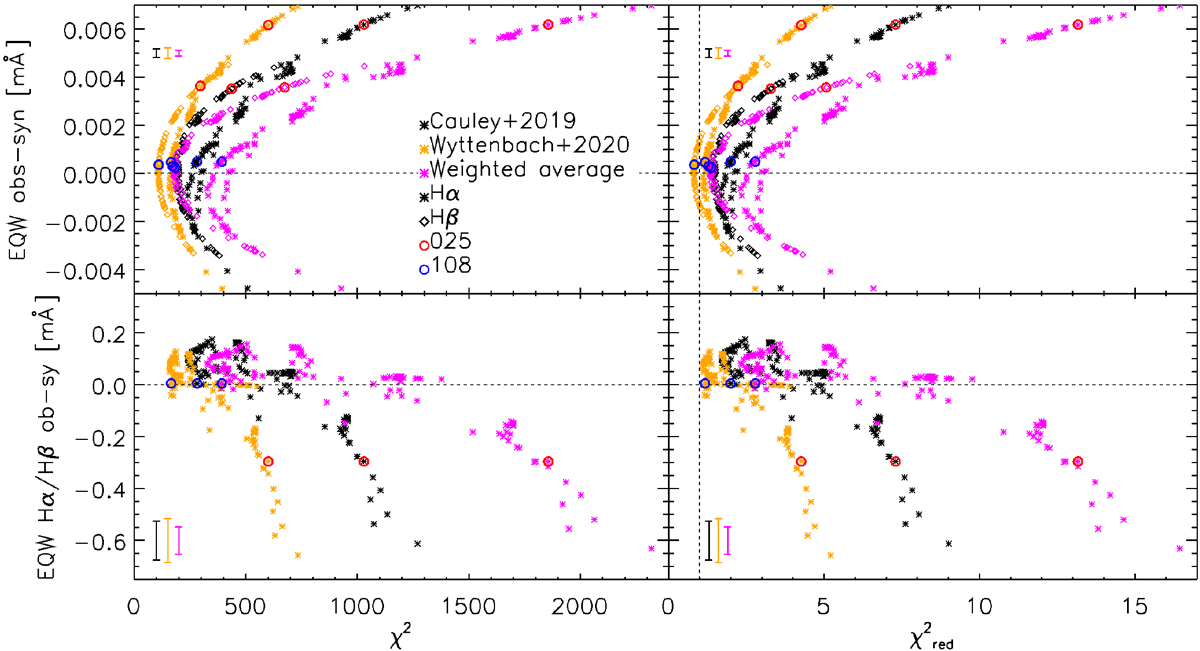
Fig. 4

Top left: χ2 vs. difference between observed and modelled equivalent width (EQW) considering the profiles obtained by Cauley et al. (2019, black), Wyttenbach et al. (2020, orange), and for the weighted average (purple). Asterisks and rhombi are for the Hα and Hβ profiles, respectively. Bottom left: χ2 obtained from the analysis of the Hα line profiles vs. difference between observed and modelled Hα-to-Hβ equivalent width ratio. The error bars at the top-left (top panel) and bottom-left (bottom panel) corners indicate the size of the equivalent width and equivalent width ratio uncertainties. Right: same as left, but with
![]() on the x-axis. The dashed lines at zero and one are to guide the eye. In all panels, the position of the results obtained with the TP profiles number 025 and 108 is marked by red and blue circles, respectively.
on the x-axis. The dashed lines at zero and one are to guide the eye. In all panels, the position of the results obtained with the TP profiles number 025 and 108 is marked by red and blue circles, respectively.
Current usage metrics show cumulative count of Article Views (full-text article views including HTML views, PDF and ePub downloads, according to the available data) and Abstracts Views on Vision4Press platform.
Data correspond to usage on the plateform after 2015. The current usage metrics is available 48-96 hours after online publication and is updated daily on week days.
Initial download of the metrics may take a while.


