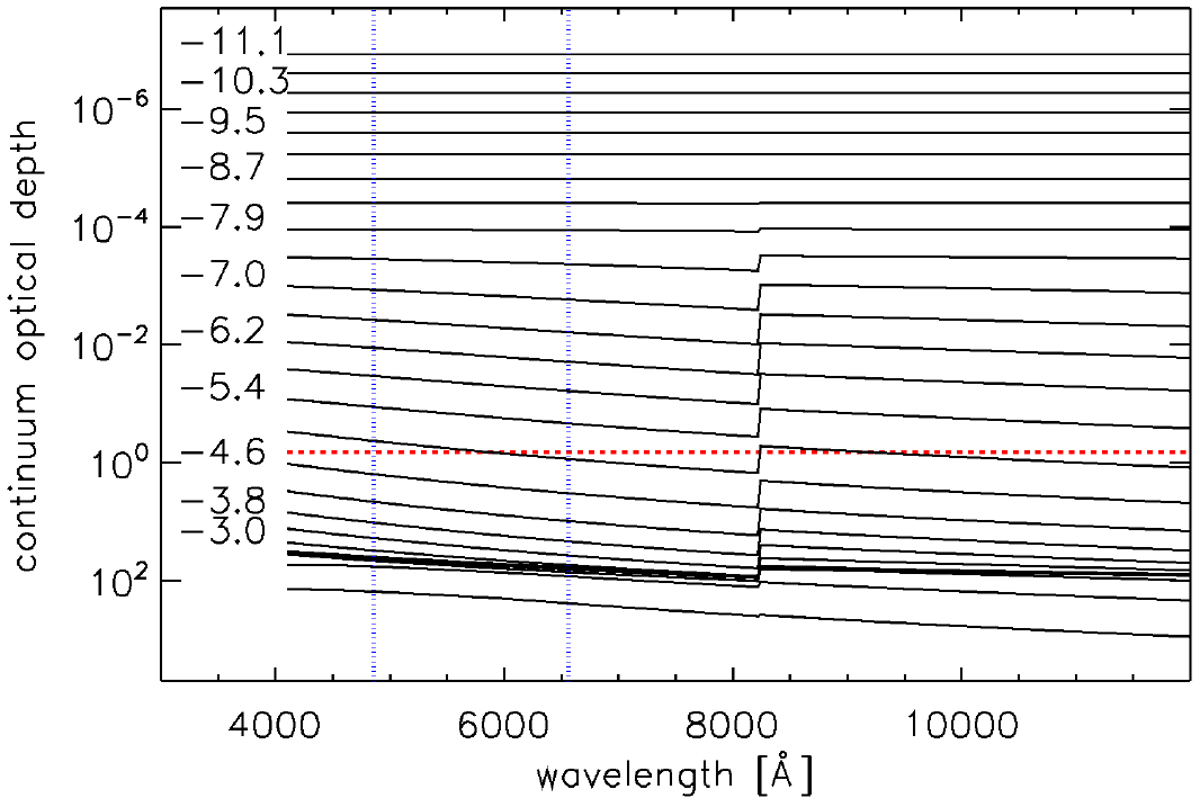
Fig. 3

Continuum optical depth as a function of wavelength in the optical range for each atmospheric layer in transmission geometry considering the TP model number 047. The values shown on the left-hand side give the logarithm of the pressure of the corresponding layer. For visualisation purposes, the pressure level is shown for every second layer starting from the top of the atmosphere and stop where the continuum optical depths of the layers start overlapping. To guide the eye, the red horizontal line is at 2/3, while the vertical blue dotted lines indicate the position of the Hα and Hβ lines.
Current usage metrics show cumulative count of Article Views (full-text article views including HTML views, PDF and ePub downloads, according to the available data) and Abstracts Views on Vision4Press platform.
Data correspond to usage on the plateform after 2015. The current usage metrics is available 48-96 hours after online publication and is updated daily on week days.
Initial download of the metrics may take a while.


