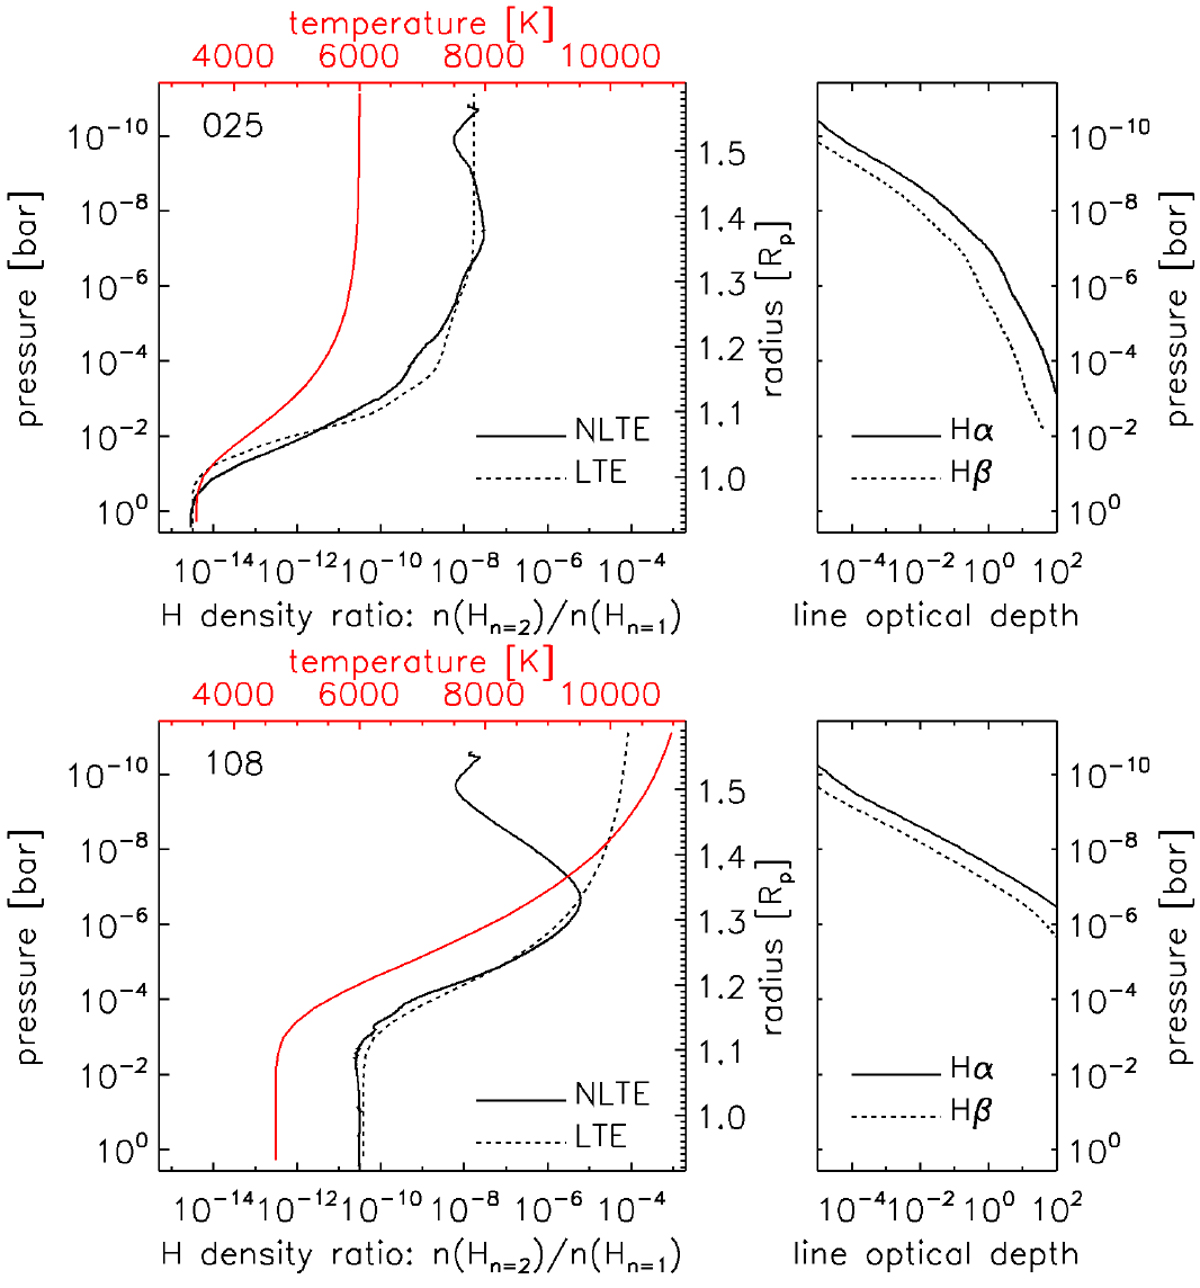
Fig. 10

Top left: ratio of the n = 2 and n = 1 level populations for neutral hydrogen (bottom x-axis) as a function of atmospheric pressure (left y-axis) and planetary radius (right y-axis) computedwith Cloudy in NLTE (solid line) and using the Boltzmann equation (i.e. LTE; dashed line) considering the TP model number 025, shown by the red line (red top x-axis). Top right: line optical depth as a function of atmospheric pressure for Hα (solid line) and Hβ (dashed line) computed with Cloudy considering the TP model number 025. Both hydrogen lines form mostly between 10−5 and 10−8 bar. Bottom: same as top panels, but for the TP model number 108.
Current usage metrics show cumulative count of Article Views (full-text article views including HTML views, PDF and ePub downloads, according to the available data) and Abstracts Views on Vision4Press platform.
Data correspond to usage on the plateform after 2015. The current usage metrics is available 48-96 hours after online publication and is updated daily on week days.
Initial download of the metrics may take a while.


