Fig. A.1
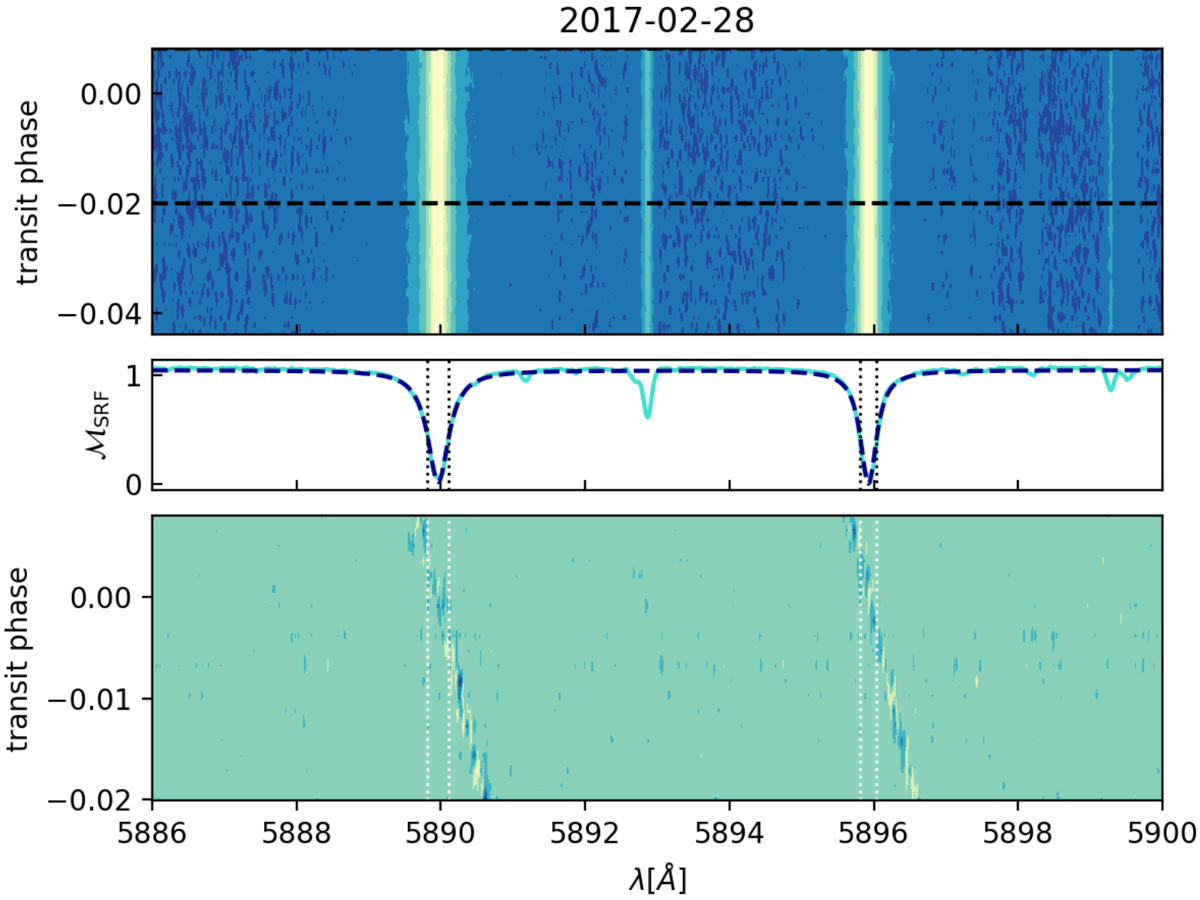
Analysis of the overlap of the stellar and planetary sodium features for night one. Upper panel: all spectra in the stellar rest frame (SRF) taken during the transit in the wavelength range of the sodium doublet stacked on top of each other to create a 2D map. The black dashed line indicate the ingress and egress (here only ingress for for this partial transit). Middle panel: the sum over all spectra in the SRF, with a line profile fit as a dark blue dashed line. The FWHM is indicated as vertical, black dotted lines. Lower panel: spectra in the planetary rest frame (PRF), after division with the master-out spectrum. The position of the FWHM of the stellar sodium feature is indicated with dotted white lines. The low S/N residuals can be seen clearly as a strong trace in the lower panel.
Current usage metrics show cumulative count of Article Views (full-text article views including HTML views, PDF and ePub downloads, according to the available data) and Abstracts Views on Vision4Press platform.
Data correspond to usage on the plateform after 2015. The current usage metrics is available 48-96 hours after online publication and is updated daily on week days.
Initial download of the metrics may take a while.