Fig. 4
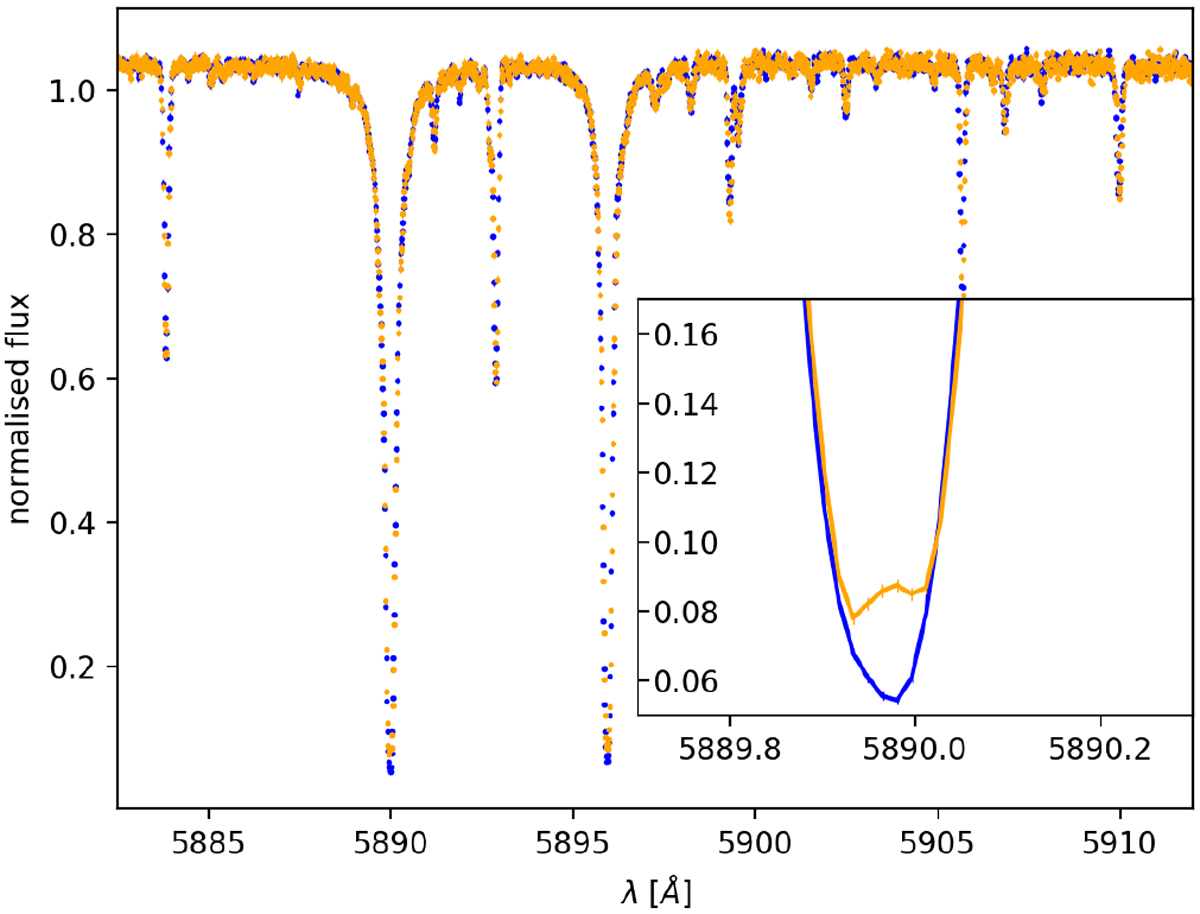
Normalised flux of the master out in the wavelength range of the sodium doublet. The stellar sodium doublet of night one isshown in blue, of night two in orange. The inset shows a zoom into the line centre of the D2 line of the same data set. Night one shows the expected line shape of the stellar sodium doublet, however, night two shows a sodium emission at line centre (width approx. 6–8 bins), which has to be masked in each spectrum to avoid a false-positive detection of the stellar sodium feature as planetary sodium.
Current usage metrics show cumulative count of Article Views (full-text article views including HTML views, PDF and ePub downloads, according to the available data) and Abstracts Views on Vision4Press platform.
Data correspond to usage on the plateform after 2015. The current usage metrics is available 48-96 hours after online publication and is updated daily on week days.
Initial download of the metrics may take a while.