Fig. 3
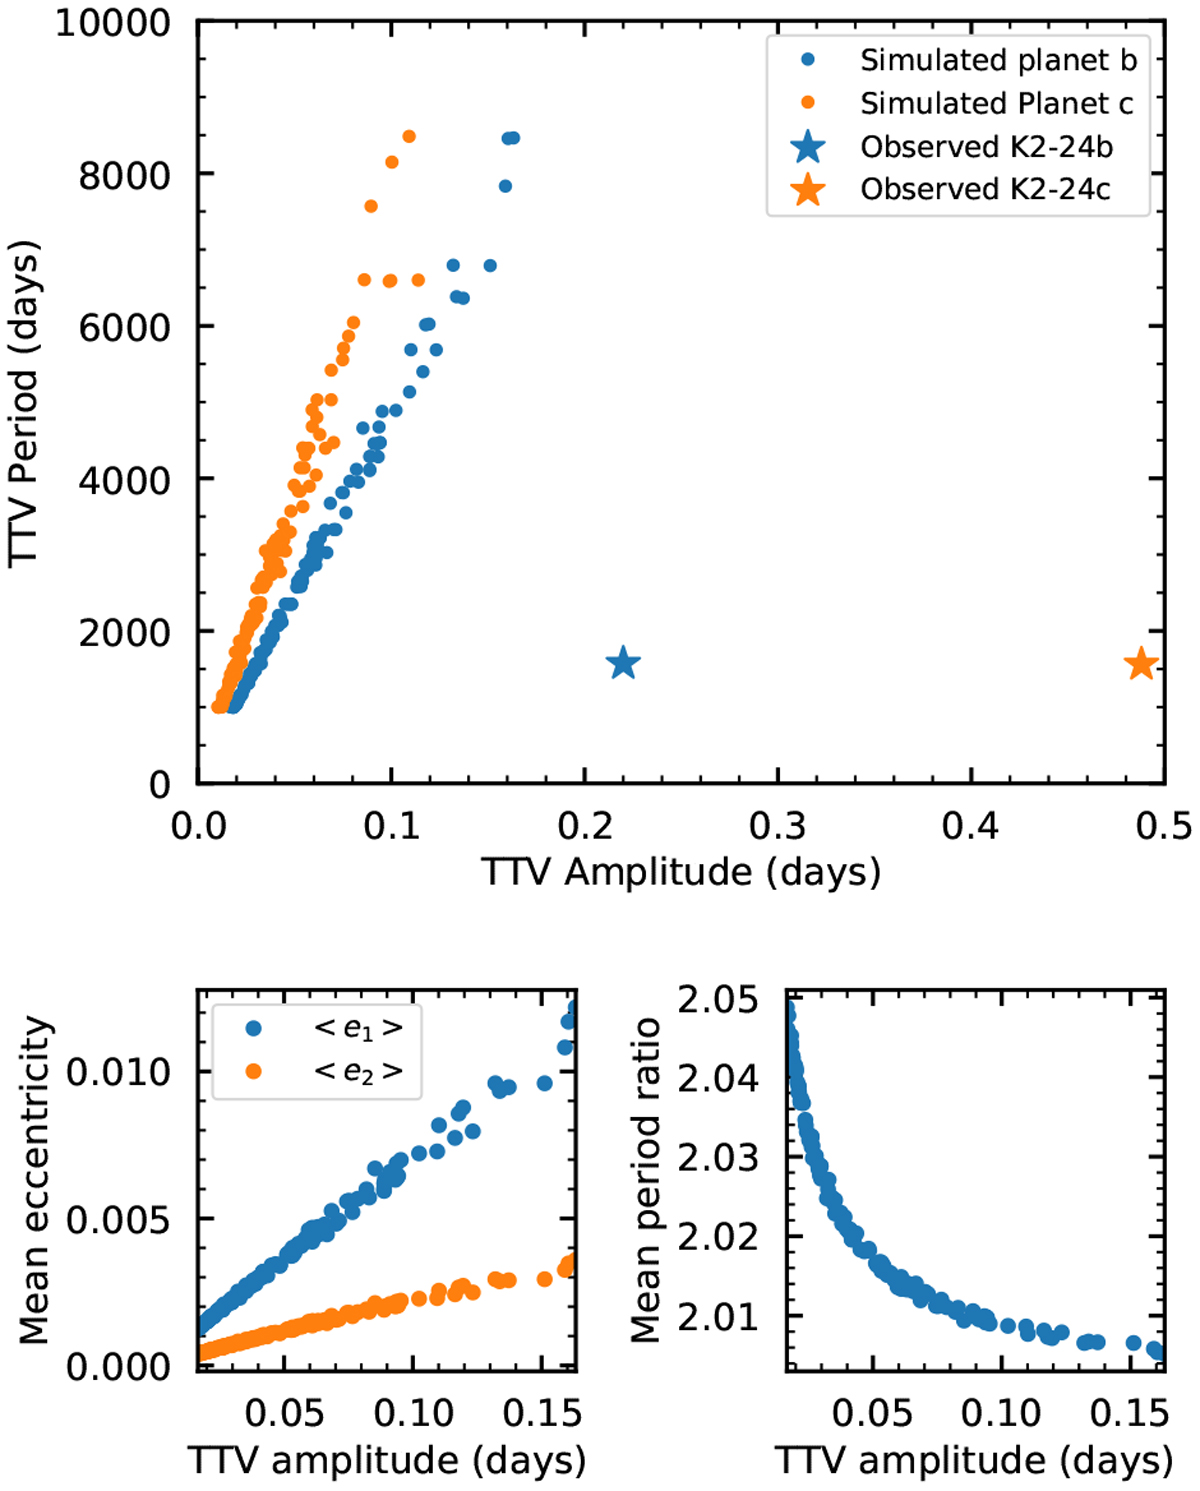
Outcome of all simulations presented in Sect. 3.3. Top panel: TTV amplitude versus TTV period for all the simulated systems. The stars show the observed TTV amplitudes and periods for K2-24 (Petigura et al. 2018). Bottom panels: mean eccentricities (left) and period ratios (right) versus TTV amplitudes of the inner planet for the simulated systems.
Current usage metrics show cumulative count of Article Views (full-text article views including HTML views, PDF and ePub downloads, according to the available data) and Abstracts Views on Vision4Press platform.
Data correspond to usage on the plateform after 2015. The current usage metrics is available 48-96 hours after online publication and is updated daily on week days.
Initial download of the metrics may take a while.