Fig. 6.
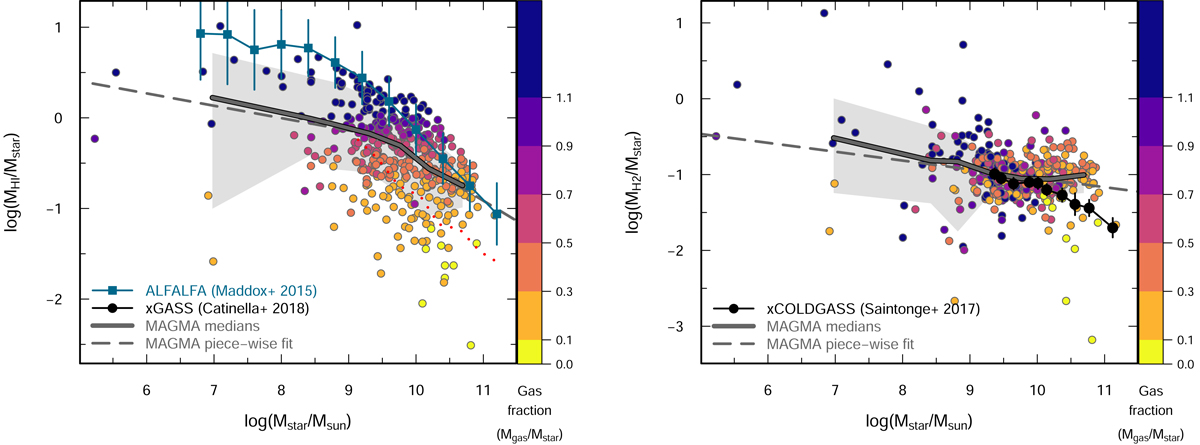
Left panel: MHI/Mstar plotted vs. Mstar (logarithmic units). The piece-wise power-law regression for MAGMA is shown by a dashed line, and the gray regions correspond to ±1 σ deviations of the binned data medians. The width of the distribution of the residuals from this fit is 0.39 dex. Also shown as filled blue squares are the data from Maddox et al. (2015) for the H I-selected ALFALFA sample as described in the text. xGASS (Catinella et al. 2018) data are shown as filled black circles; these include H I non-detections (see their Table 1) so tend to be biased low relative to MAGMA with H I detections only. Right panel: MH2/Mstar plotted vs. Mstar. The filled black circles correspond to data from xCOLDGASS (Saintonge et al. 2017), and include only main-sequence galaxies (see their Table 6). In both panels, the MAGMA medians of binned data are shown by heavy gray lines, and MAGMA galaxies are colored by gas fraction as in Fig. 1.
Current usage metrics show cumulative count of Article Views (full-text article views including HTML views, PDF and ePub downloads, according to the available data) and Abstracts Views on Vision4Press platform.
Data correspond to usage on the plateform after 2015. The current usage metrics is available 48-96 hours after online publication and is updated daily on week days.
Initial download of the metrics may take a while.