Fig. 5.
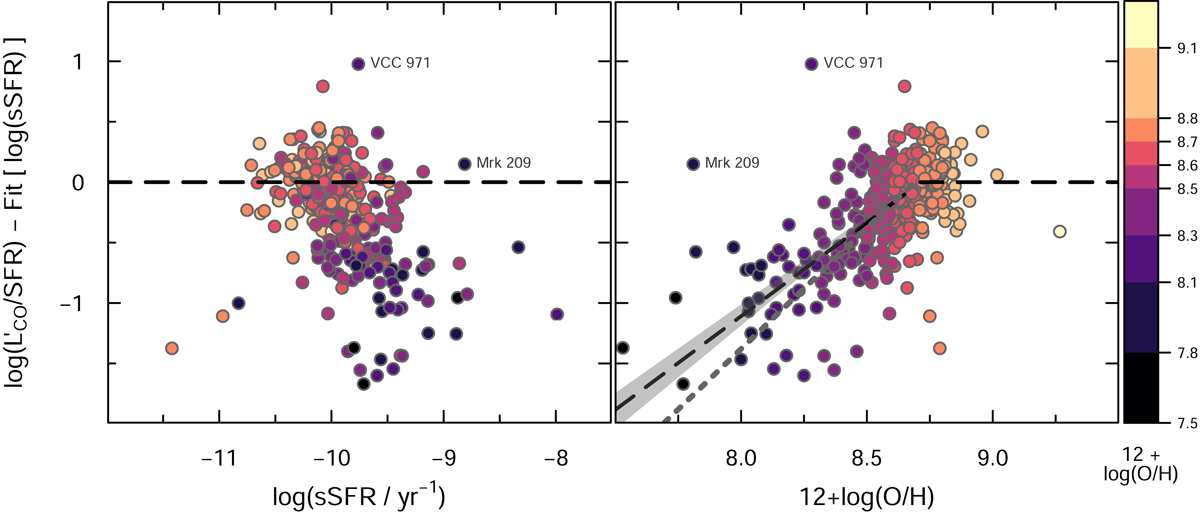
Residuals of the fit given by Eq. (4) plotted against specific SFR (left panel) and 12 + log(O/H) (right). The metal-poor portion of the piece-wise regression in the right panel is given by ![]() , and the “fit” refers to Eq. (4), both shown by long-dashed (gray) lines. The gray shadowed region in the right panel indicates the range of uncertainty on the slope in the above equation, and the short-dashed (gray) line corresponds to a power-law slope of 2.0 (compared to the best-fit value here of 1.55). As in Fig. 2, galaxies are color-coded by 12 + log(O/H).
, and the “fit” refers to Eq. (4), both shown by long-dashed (gray) lines. The gray shadowed region in the right panel indicates the range of uncertainty on the slope in the above equation, and the short-dashed (gray) line corresponds to a power-law slope of 2.0 (compared to the best-fit value here of 1.55). As in Fig. 2, galaxies are color-coded by 12 + log(O/H).
Current usage metrics show cumulative count of Article Views (full-text article views including HTML views, PDF and ePub downloads, according to the available data) and Abstracts Views on Vision4Press platform.
Data correspond to usage on the plateform after 2015. The current usage metrics is available 48-96 hours after online publication and is updated daily on week days.
Initial download of the metrics may take a while.