Free Access
Fig. 4.
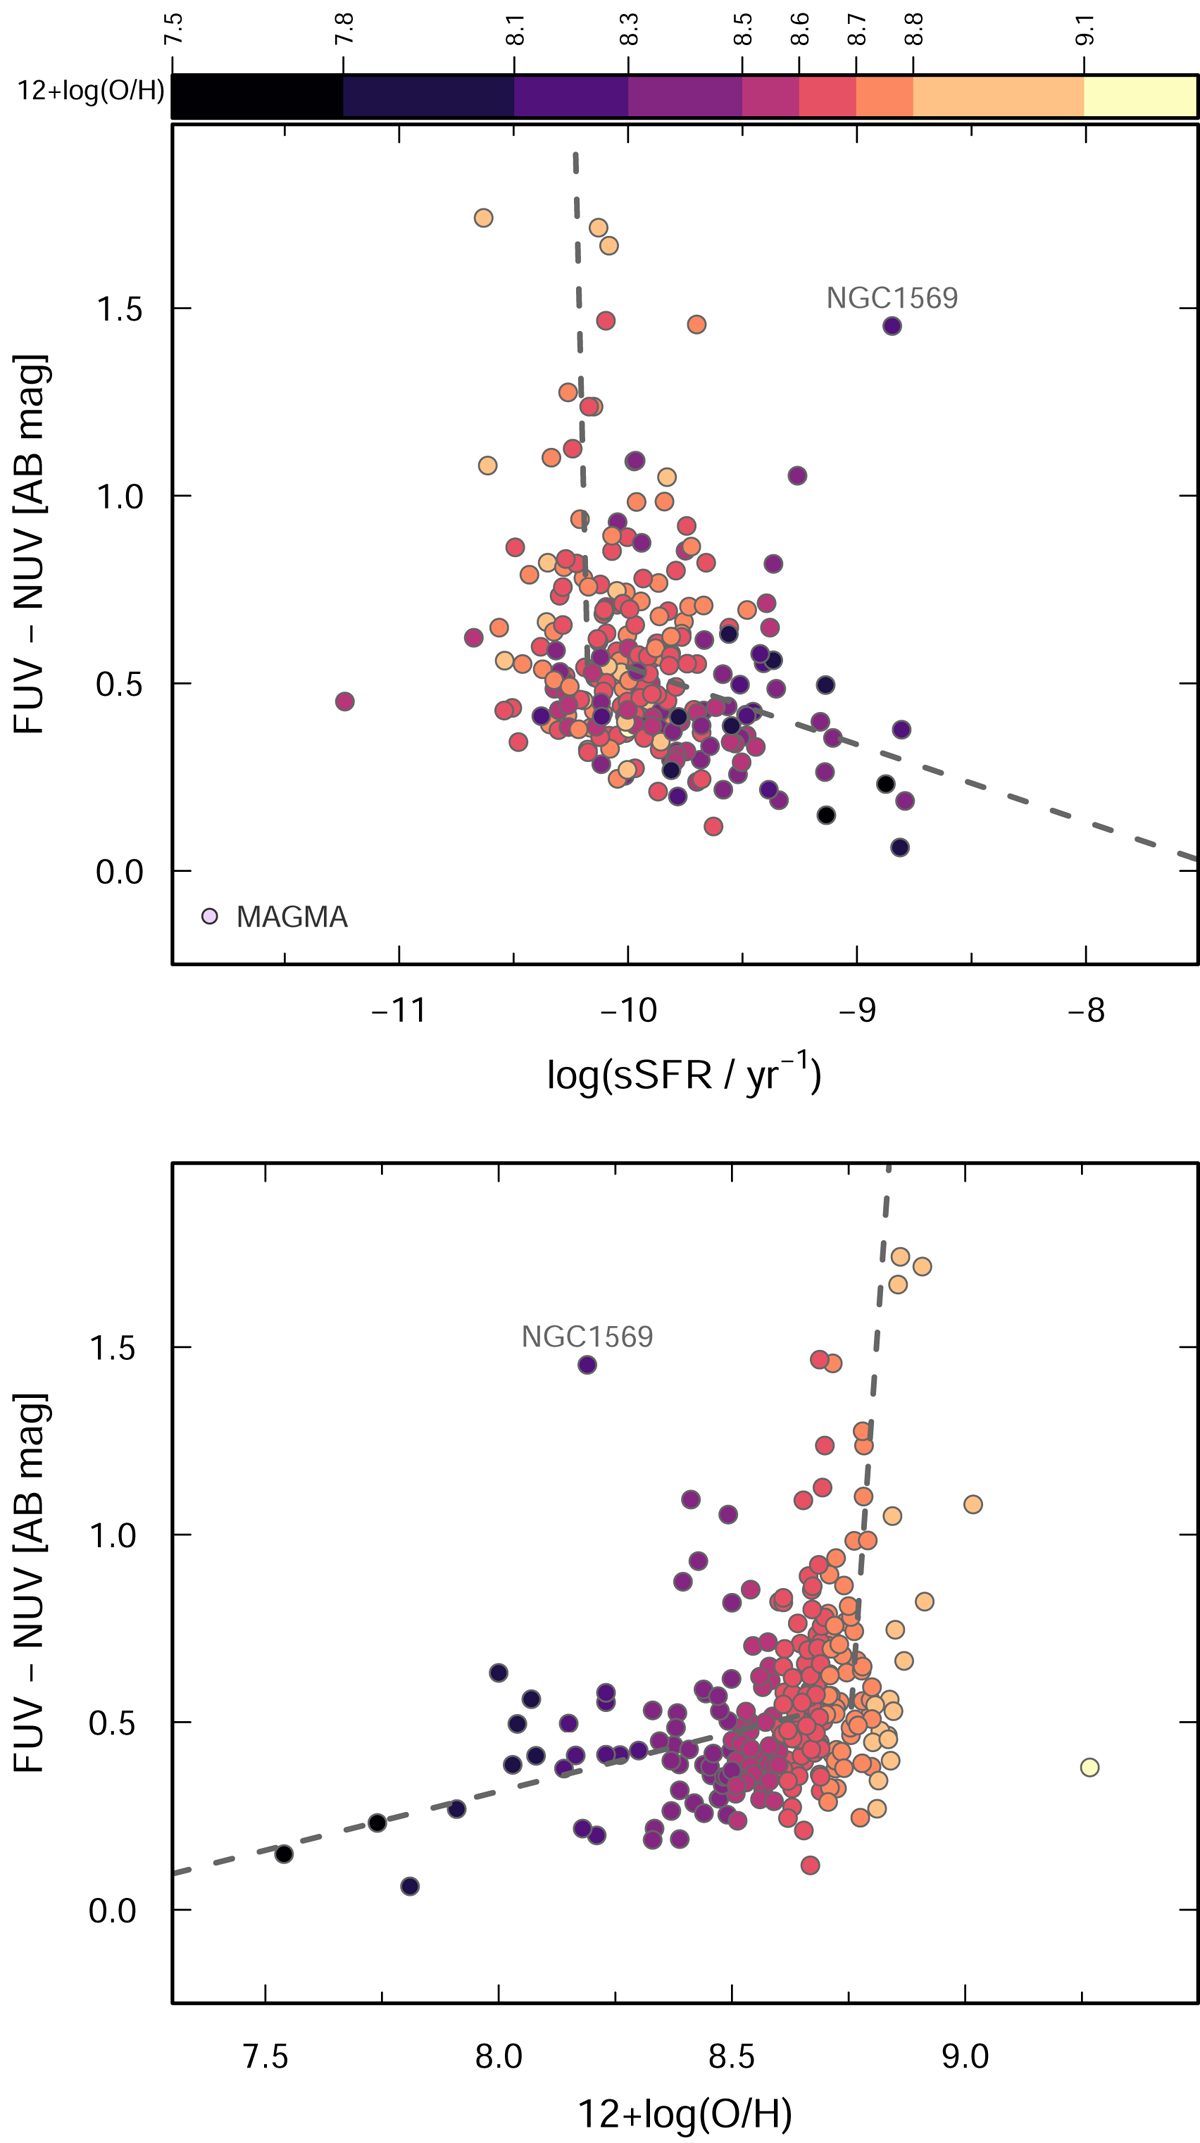
GALEX FUV−NUV color plotted against log(sSFR) (top panel), and 12 + log(O/H) (bottom). Like in Fig. 2, galaxies are color-coded by 12 + log(O/H). The long-dashed lines correspond to an approximation of the GALEX Blue Sequence and GALEX Red Sequence as a function of O/H as described in the text.
Current usage metrics show cumulative count of Article Views (full-text article views including HTML views, PDF and ePub downloads, according to the available data) and Abstracts Views on Vision4Press platform.
Data correspond to usage on the plateform after 2015. The current usage metrics is available 48-96 hours after online publication and is updated daily on week days.
Initial download of the metrics may take a while.