Fig. 3.
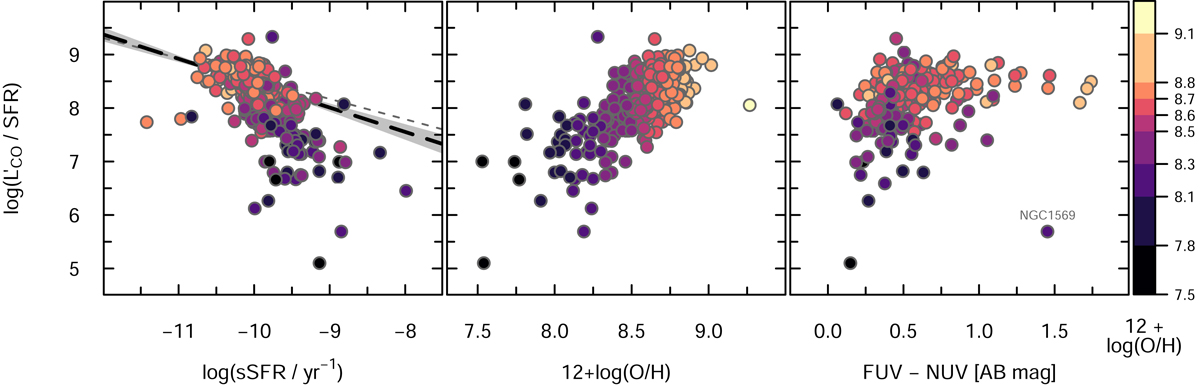
Ratio of CO luminosity ![]() and SFR plotted against specific SFR (left panel), 12 + log(O/H) (middle), and GALEX FUV−NUV color (right). In the left panel, the long-dashed line corresponds to the robust fit given by Eq. (4) and the (gray) line to the shallower slope (−0.38) from Hunt et al. (2015). The gray shadowed region in the leftmost panel indicates the range of uncertainty on the slope in Eq. (4). Galaxies are color-coded by 12 + log(O/H) as in Fig. 2.
and SFR plotted against specific SFR (left panel), 12 + log(O/H) (middle), and GALEX FUV−NUV color (right). In the left panel, the long-dashed line corresponds to the robust fit given by Eq. (4) and the (gray) line to the shallower slope (−0.38) from Hunt et al. (2015). The gray shadowed region in the leftmost panel indicates the range of uncertainty on the slope in Eq. (4). Galaxies are color-coded by 12 + log(O/H) as in Fig. 2.
Current usage metrics show cumulative count of Article Views (full-text article views including HTML views, PDF and ePub downloads, according to the available data) and Abstracts Views on Vision4Press platform.
Data correspond to usage on the plateform after 2015. The current usage metrics is available 48-96 hours after online publication and is updated daily on week days.
Initial download of the metrics may take a while.