Fig. 2.
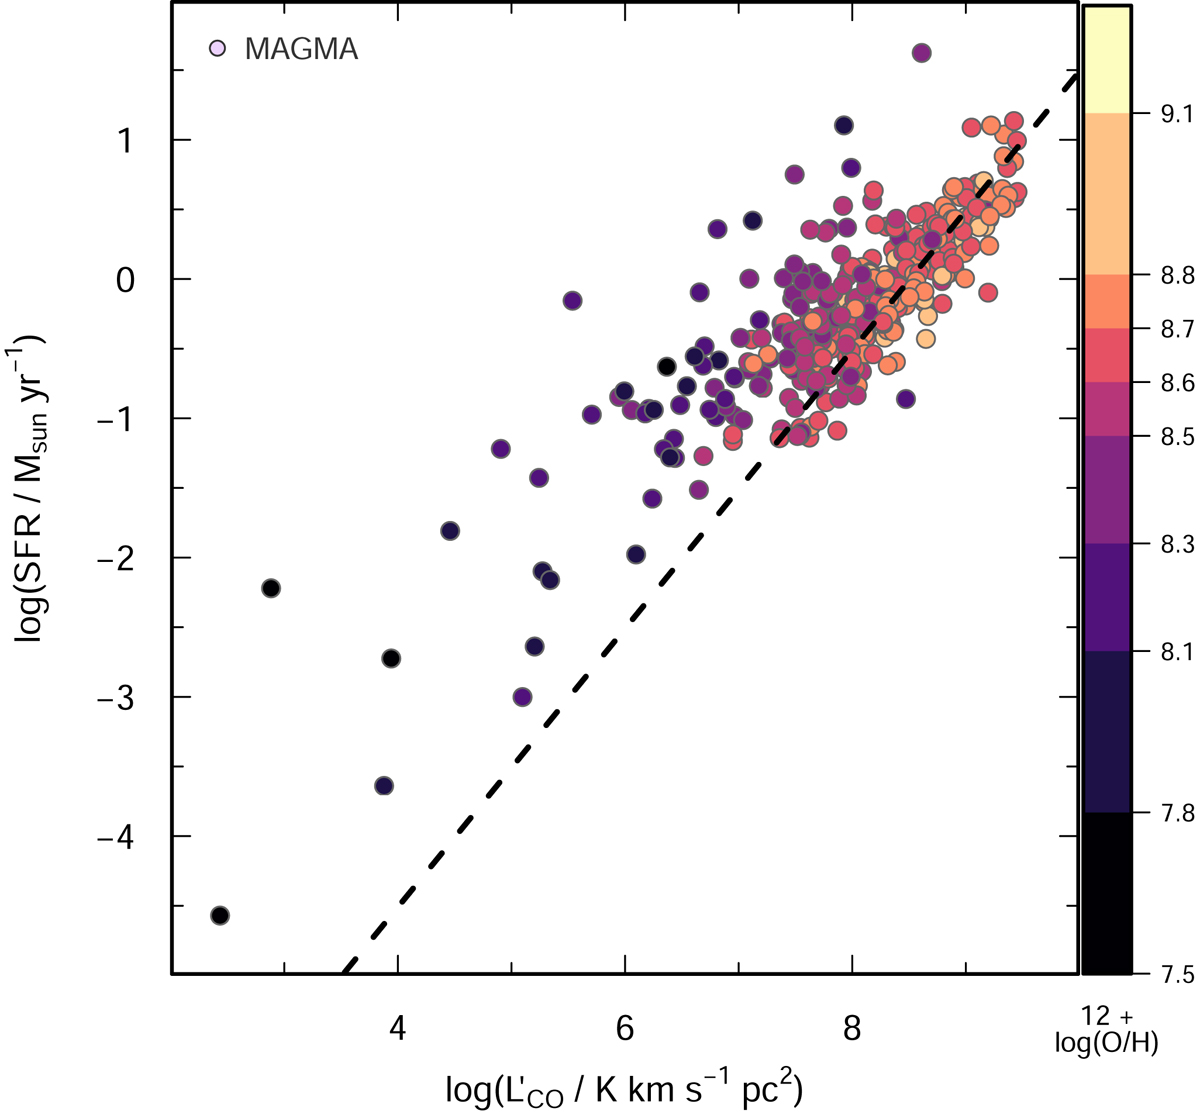
SFR plotted against CO luminosity ![]() . The regression shown by a long-dashed line indicates an imposed unit slope and a best-fit offset of −8.51 ± 0.02, roughly consistent with the correlation found by Gao & Solomon (2004) as described in the text. Galaxies are color-coded by 12 + log(O/H) as indicated in the color wedge in the far-right panel.
. The regression shown by a long-dashed line indicates an imposed unit slope and a best-fit offset of −8.51 ± 0.02, roughly consistent with the correlation found by Gao & Solomon (2004) as described in the text. Galaxies are color-coded by 12 + log(O/H) as indicated in the color wedge in the far-right panel.
Current usage metrics show cumulative count of Article Views (full-text article views including HTML views, PDF and ePub downloads, according to the available data) and Abstracts Views on Vision4Press platform.
Data correspond to usage on the plateform after 2015. The current usage metrics is available 48-96 hours after online publication and is updated daily on week days.
Initial download of the metrics may take a while.