Fig. B.2.
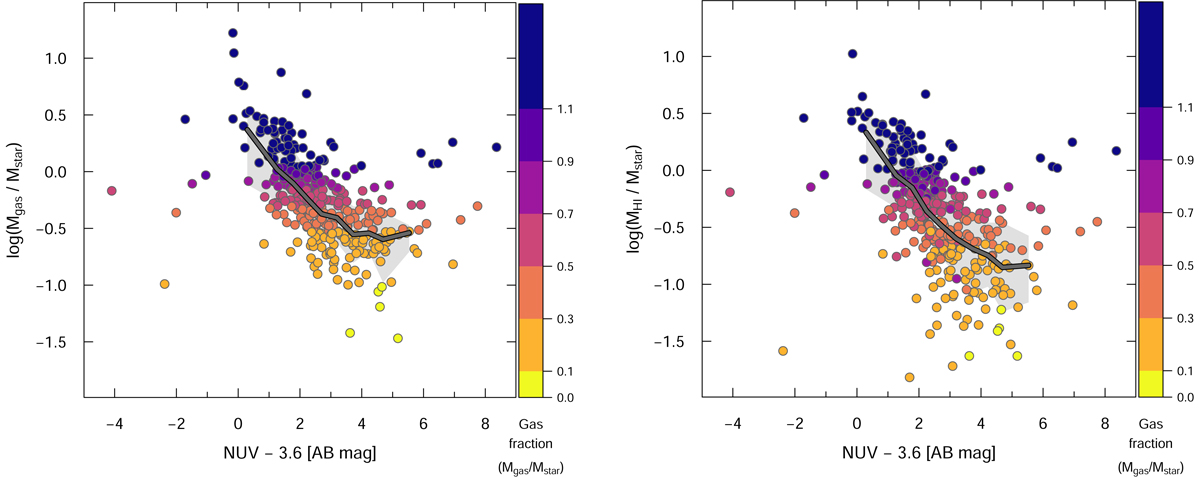
Total gas fraction (Mgas/Mstar) plotted against the NUV-W1 (AB) magnitude (left panel) and H I fraction (MHI/Mstar) vs. NUV-W1 (right). Both magnitudes have been corrected for Galactic extinction as described in Sect. 3. The MAGMA medians are shown as a heavy gray line, and the light-gray region corresponds to ±1σ in the distributions. The contribution of H2 to Mgas is evident in the upturn in the Mgas fraction for red NUV-W1 colors in the left panel, compared to the right.
Current usage metrics show cumulative count of Article Views (full-text article views including HTML views, PDF and ePub downloads, according to the available data) and Abstracts Views on Vision4Press platform.
Data correspond to usage on the plateform after 2015. The current usage metrics is available 48-96 hours after online publication and is updated daily on week days.
Initial download of the metrics may take a while.