Fig. 15.
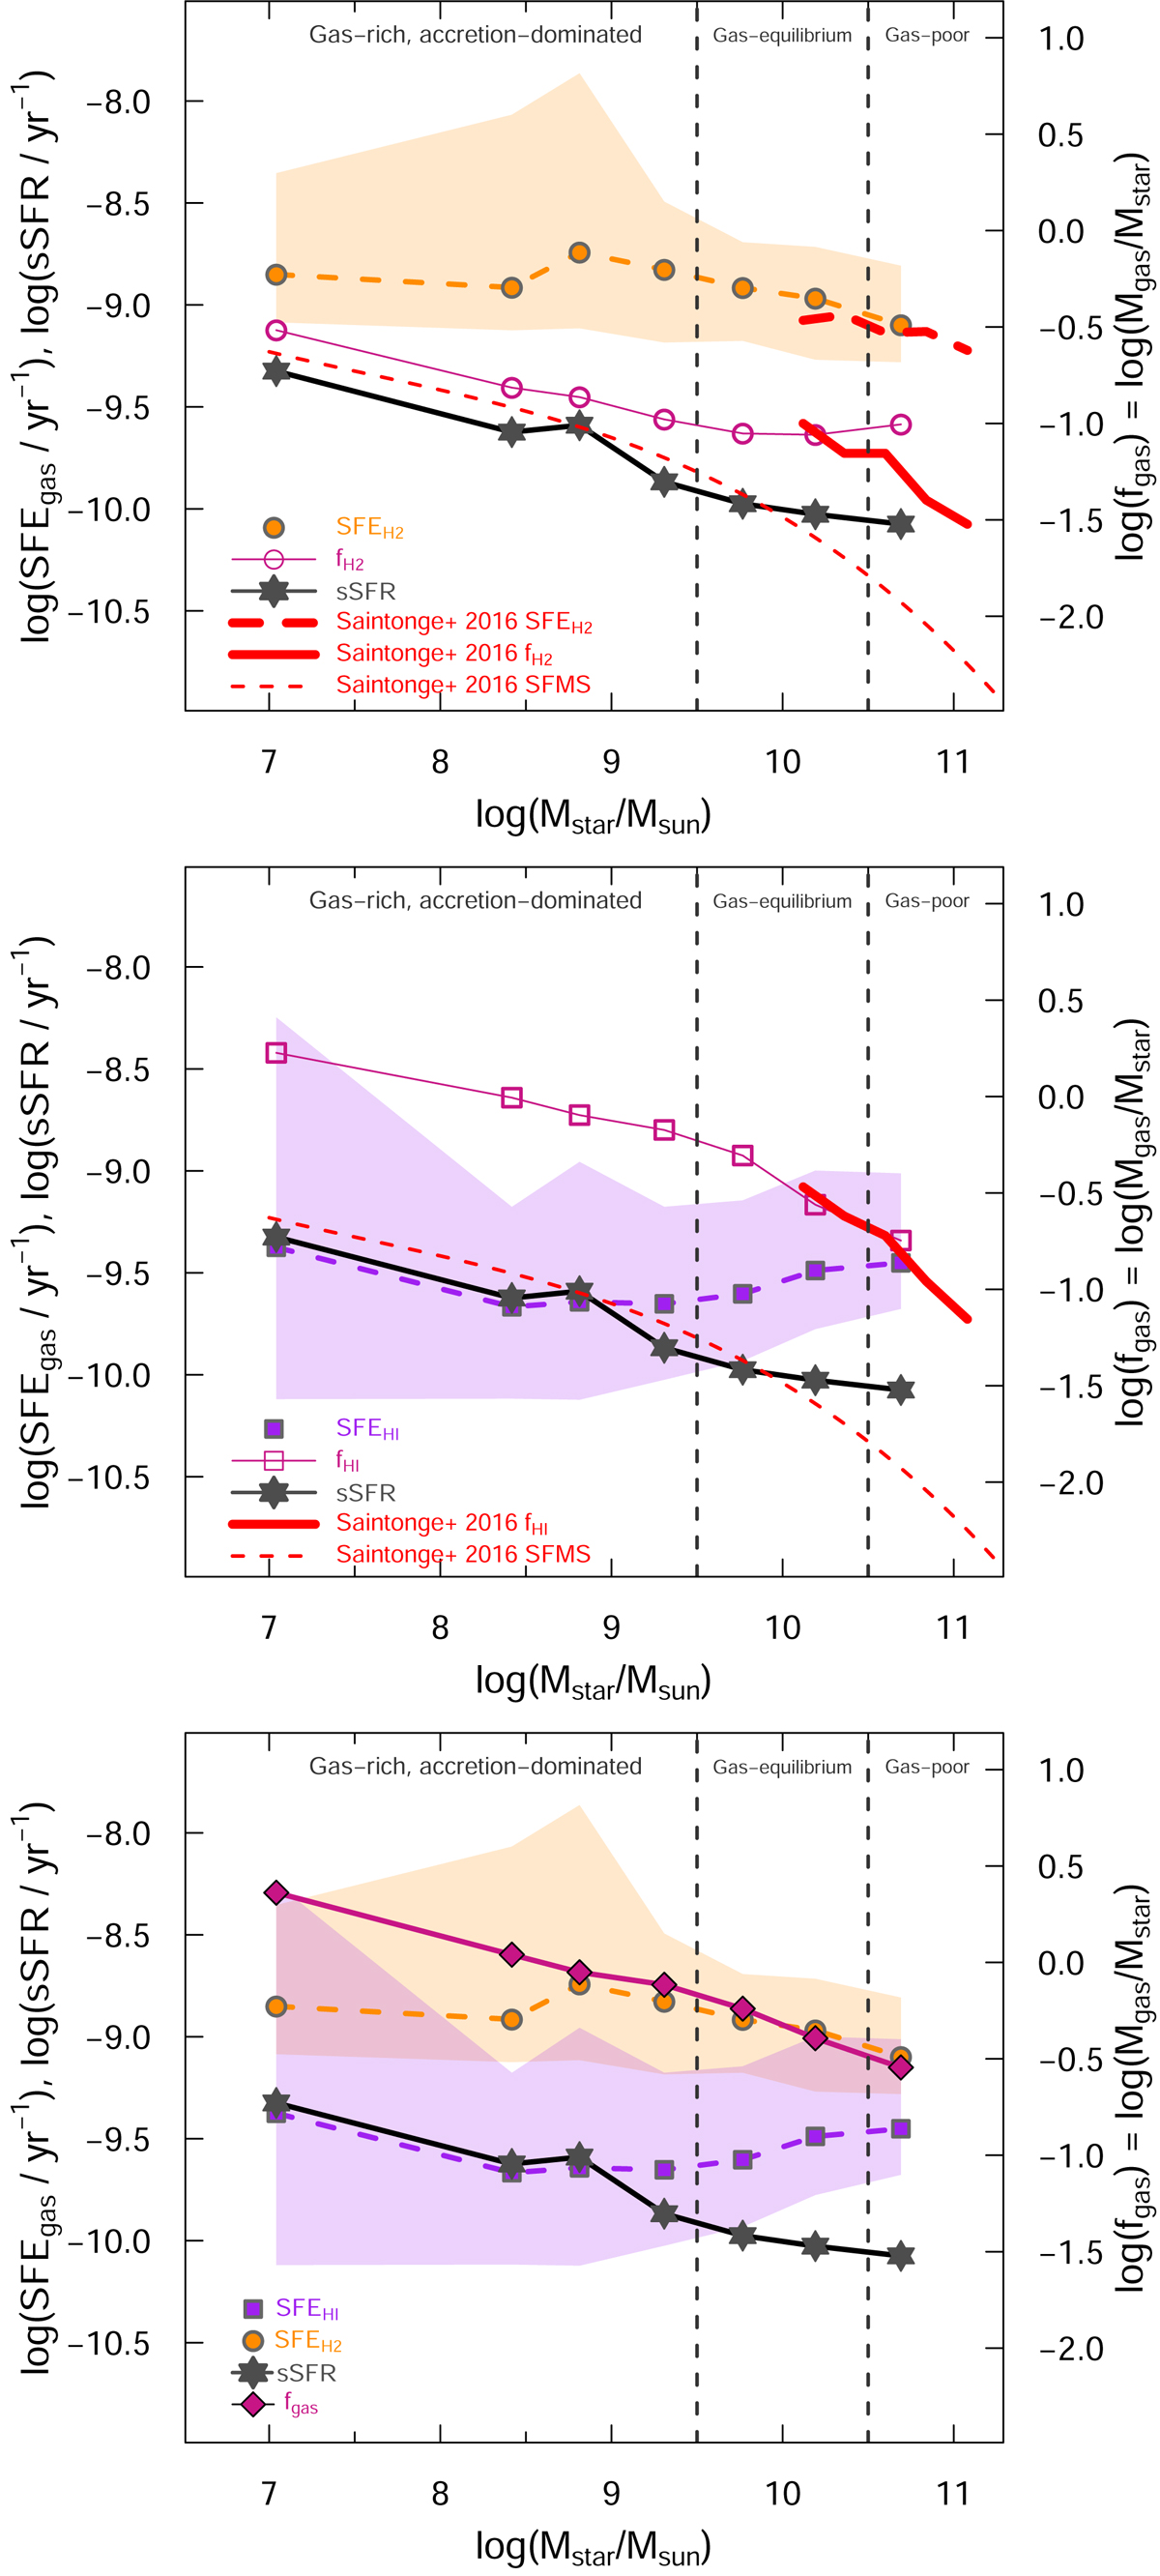
Star-formation efficiency with H2 (SFEH2 and H2 gas fraction fH2 plotted against stellar mass (top panel); the analogous quantities but for H I (middle); and with total gas fraction fgas (bottom). In all panels, the left-hand axis gives the SFE and sSFR units, while the right-hand one corresponds to gas fractions, both logarithmic scale. The binned medians for τH2 are shown by orange circles and fH2 by open violet circles; the same quantities for H I are indicated by purple squares and open violet squares. Only bins with ≥5 data points are shown. Also plotted is the (binned) SFMS reported in Fig. 1, here shown by six-sided stars. Trends from Saintonge et al. (2016) are also shown by red curves as indicated in the legend in the lower left-hand corner. The shaded region correspond to ±1σ spreads of the binned parameters. The three Mstar bins discussed in the text are delineated by vertical dashed lines.
Current usage metrics show cumulative count of Article Views (full-text article views including HTML views, PDF and ePub downloads, according to the available data) and Abstracts Views on Vision4Press platform.
Data correspond to usage on the plateform after 2015. The current usage metrics is available 48-96 hours after online publication and is updated daily on week days.
Initial download of the metrics may take a while.