Fig. 14.
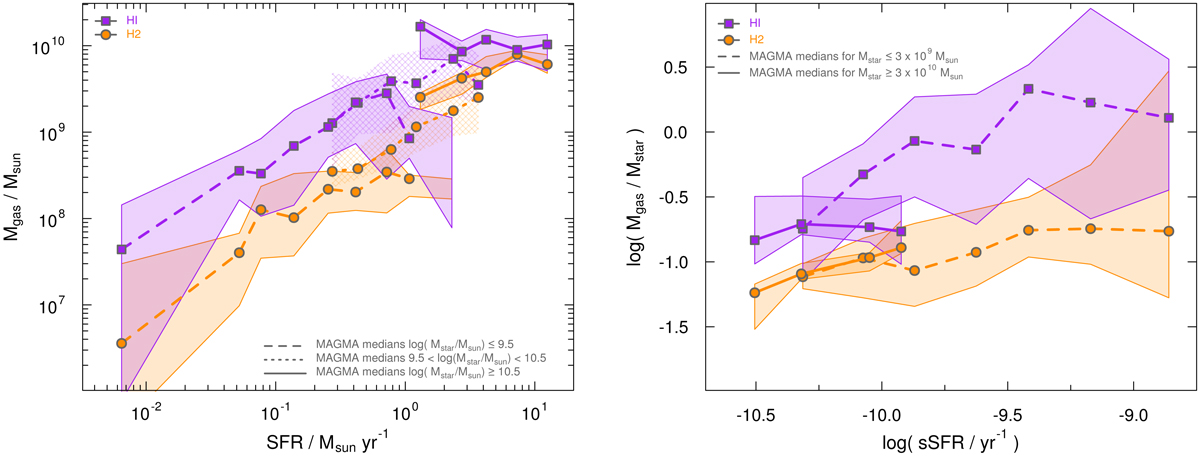
Gas mass plotted against SFR (left) and ratio of gas mass and stellar mass plotted against sSFR (right, in logarithmic units). In both panels, the MAGMA sample has been divided into three Mstar bins (Mstar ≤3 × 10⁹ M⊙, 143 galaxies; 3 × 10⁹ M⊙ < Mstar < 3 × 10¹⁰ M⊙, 210 galaxies; Mstar ≥3 × 10¹⁰ M⊙, 39 galaxies). The binned medians for MH2 are shown by orange circles and MHI by purple squares; only bins with number of galaxies ≥4 are plotted. The low-Mstar bins are connected with dashed lines, the high-mass bins with solid ones, and the intermediate bin with dot-dashed; the hatched area shows the spreads of the intermediate Mstar regime. The shaded regions correspond to ±1σ spreads of the binned parameters. In the right panel, only the highest and lowest Mstar bins are shown.
Current usage metrics show cumulative count of Article Views (full-text article views including HTML views, PDF and ePub downloads, according to the available data) and Abstracts Views on Vision4Press platform.
Data correspond to usage on the plateform after 2015. The current usage metrics is available 48-96 hours after online publication and is updated daily on week days.
Initial download of the metrics may take a while.