Fig. 13.
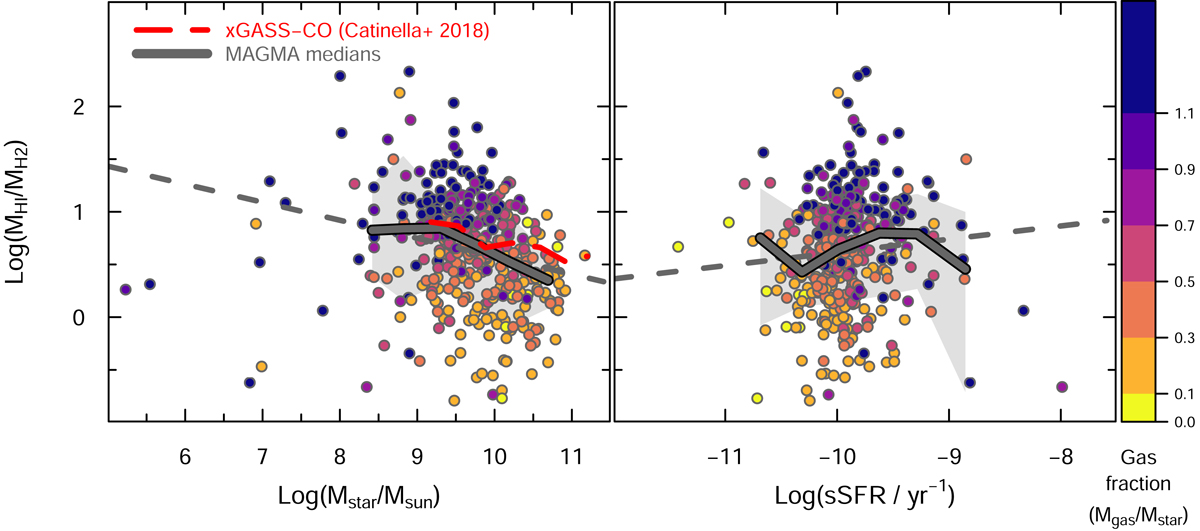
Mass ratio of atomic-to-molecular gas plotted vs. Mstar in the left panel, and vs. sSFR in the right (both in logarithmic units). As in Fig. 12, the long-dashed lines correspond to the best-fit power-law regressions, and the heavy curve to the MAGMA medians. The gray regions show the ±1σ excursions of the data. The heavy red long-dashed curve corresponds to the binned data from xGASS-CO (see Catinella et al. 2018). Galaxies are colored by gas fraction as in Fig. 1.
Current usage metrics show cumulative count of Article Views (full-text article views including HTML views, PDF and ePub downloads, according to the available data) and Abstracts Views on Vision4Press platform.
Data correspond to usage on the plateform after 2015. The current usage metrics is available 48-96 hours after online publication and is updated daily on week days.
Initial download of the metrics may take a while.