Fig. 12.
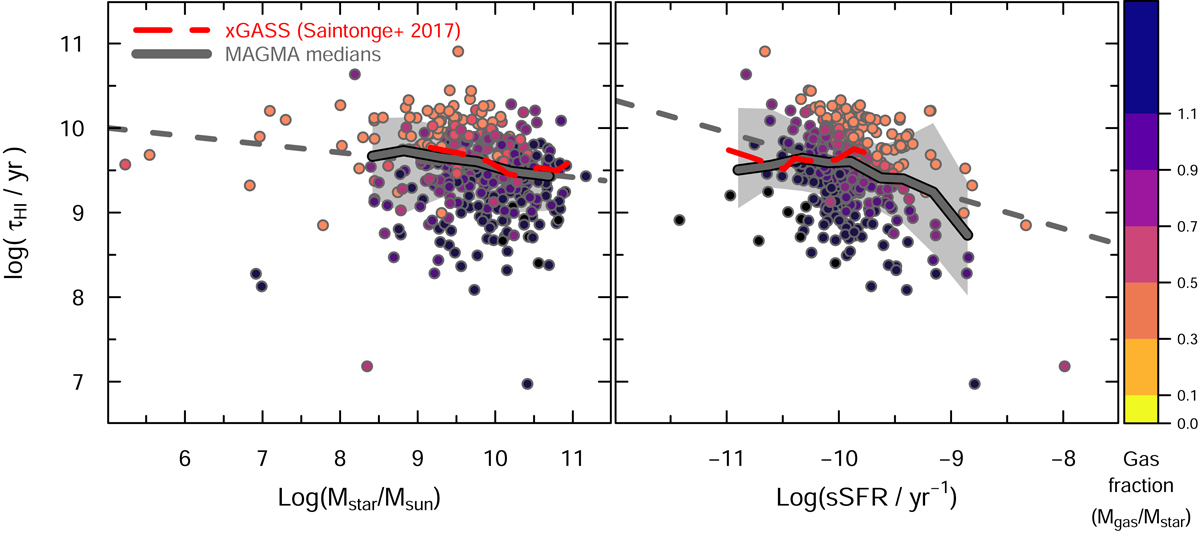
Atomic gas depletion time, τHI, plotted against Mstar in the left panel, and against sSFR in the right (both in logarithmic units). The best-fit power-law regressions are shown by short-dashed gray lines in both panels, and the MAGMA medians by a heavy curve; the gray regions correspond to ±1σ of the data. The heavy red long-dashed curves give the xCOLDGASS medians (Saintonge et al. 2017). As in Fig. 1, galaxies are colored by gas fraction.
Current usage metrics show cumulative count of Article Views (full-text article views including HTML views, PDF and ePub downloads, according to the available data) and Abstracts Views on Vision4Press platform.
Data correspond to usage on the plateform after 2015. The current usage metrics is available 48-96 hours after online publication and is updated daily on week days.
Initial download of the metrics may take a while.