Fig. 11.
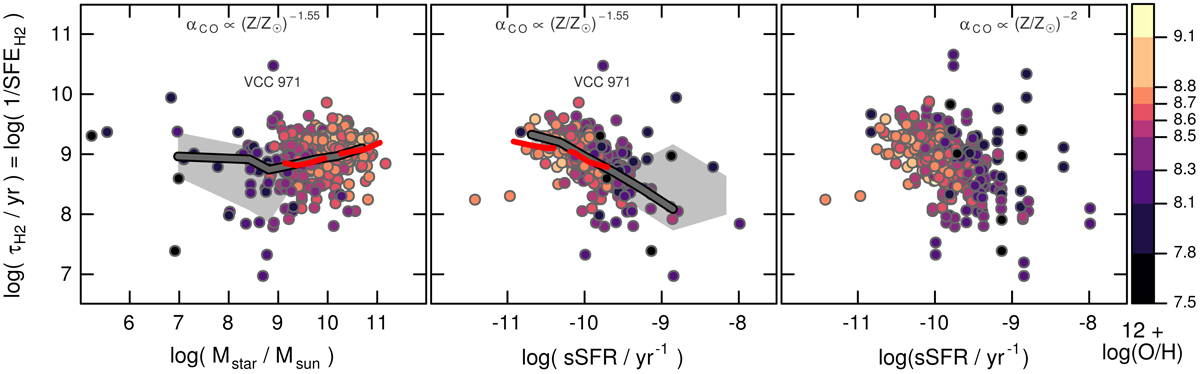
Logarithm of H2 depletion time τH2 plotted against Mstar in the left panel, and against specific SFR in the middle and right panels. In the middle and right panels, the heavy dark-gray curves correspond to the binned data medians; only bins with 5 or more galaxies are shown. The gray shadowed regions indicate the range of ±1σ of the binned data. The heavy red long-dashed curves give the xCOLDGASS medians (Saintonge et al. 2017). The right panel shows the impact of using αCO ∝ (Z/Z⊙)2, rather than the value we find here. Galaxies are colored with 12 + log(O/H) is as in Fig. 2.
Current usage metrics show cumulative count of Article Views (full-text article views including HTML views, PDF and ePub downloads, according to the available data) and Abstracts Views on Vision4Press platform.
Data correspond to usage on the plateform after 2015. The current usage metrics is available 48-96 hours after online publication and is updated daily on week days.
Initial download of the metrics may take a while.