Fig. 10.
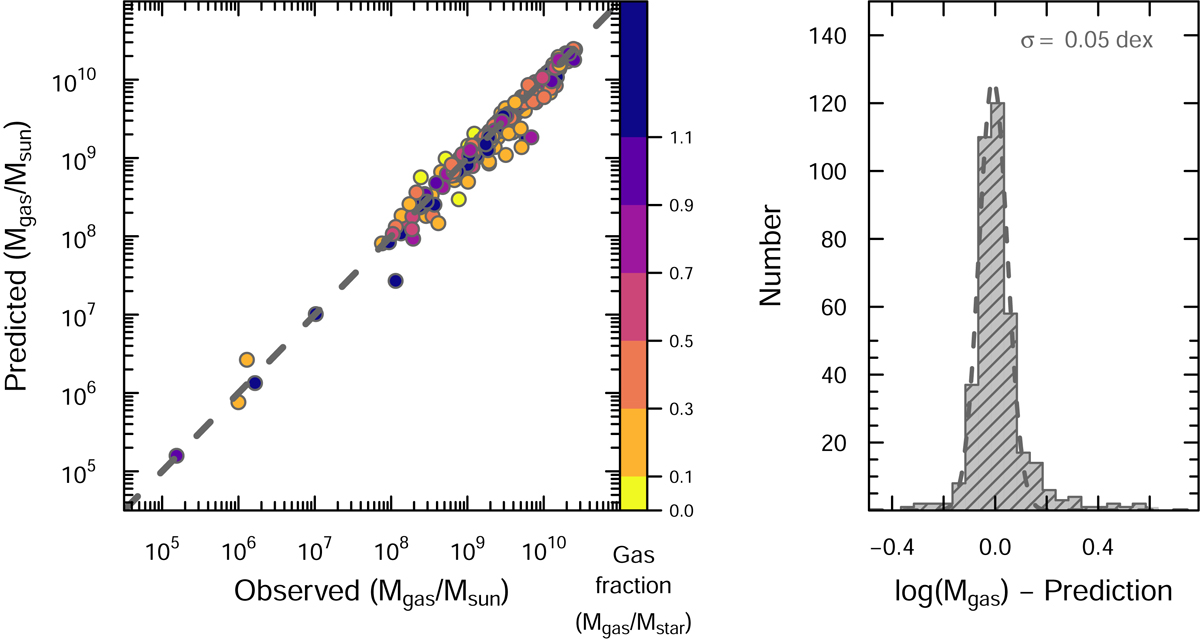
Observed values of log(Mgas) in the MAGMA sample compared to those predicted by Eq. (11) as a function of Mstar, SFR, and MHI; the regression is illustrated by the gray-dashed line. Unlike Fig. 9 and Eq. (10), here the independent variables include MHI. The right panel shows the residuals and the Gaussian fit; the 1σ dispersion of the Gaussian is ∼0.05 dex as discussed in the text. Galaxies are colored by gas fraction as shown in previous figures.
Current usage metrics show cumulative count of Article Views (full-text article views including HTML views, PDF and ePub downloads, according to the available data) and Abstracts Views on Vision4Press platform.
Data correspond to usage on the plateform after 2015. The current usage metrics is available 48-96 hours after online publication and is updated daily on week days.
Initial download of the metrics may take a while.