Fig. 1.
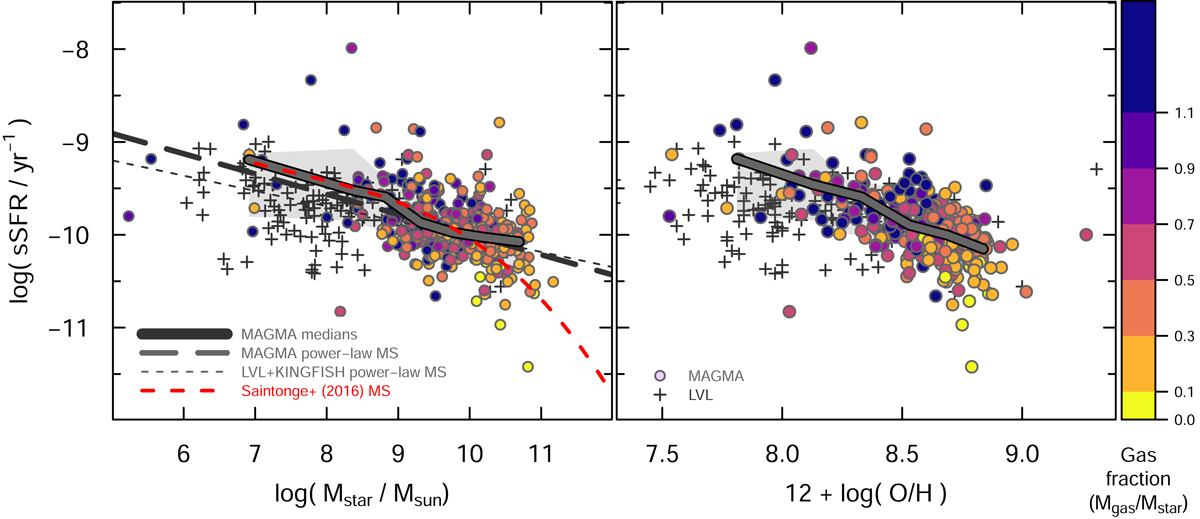
sSFR plotted against Mstar in logarithmic units (left panel) and 12 + log(O/H) (right) for the MAGMA sample. The heavy dark-gray curves correspond to the medians of the binned MAGMA data, and the underlying gray region to a standard deviation in either direction. The dark-gray plus signs report galaxies from the LVL sample as described in the text. The regression shown by the long-dashed line indicates the best (power-law) fit for the SFMS to MAGMA, as given by Eq. (1), and the short-dashed line to fit of LVL+KINGFISH galaxies as described in the text. The heavy dashed (red) curve corresponds to the [cubic in log(Mstar)] SFMS found by Saintonge et al. (2016). Galaxies are color-coded by gas fraction (fgas, here defined as Mgas/Mstar) as indicated in the color wedge in the right-most panel.
Current usage metrics show cumulative count of Article Views (full-text article views including HTML views, PDF and ePub downloads, according to the available data) and Abstracts Views on Vision4Press platform.
Data correspond to usage on the plateform after 2015. The current usage metrics is available 48-96 hours after online publication and is updated daily on week days.
Initial download of the metrics may take a while.