Fig. 12.
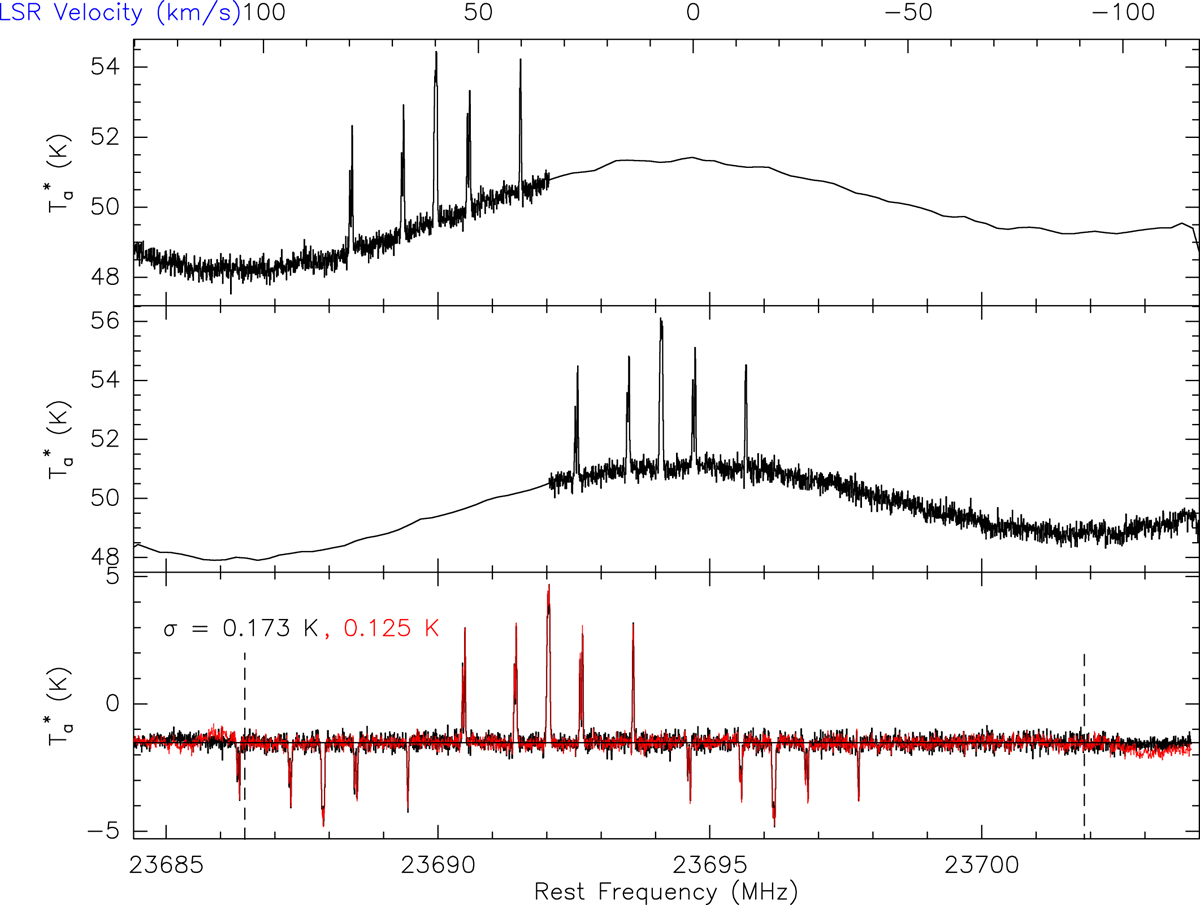
Same NH3 data from GBT + VEGAS spectrometer as in Fig. 9. The top window shows the first frequency-shifted spectrum with the right-hand side smoothed by a median of 0.4 MHz in width. The middle window shows the second frequency-shifted spectrum smoothed on the left-hand side. The bottom window shows a comparison between the original folded spectrum and the half-smoothed folded spectrum. The baseline is computed between the two vertical dashed lines as in Fig. 9.
Current usage metrics show cumulative count of Article Views (full-text article views including HTML views, PDF and ePub downloads, according to the available data) and Abstracts Views on Vision4Press platform.
Data correspond to usage on the plateform after 2015. The current usage metrics is available 48-96 hours after online publication and is updated daily on week days.
Initial download of the metrics may take a while.