Free Access
Fig. 3.
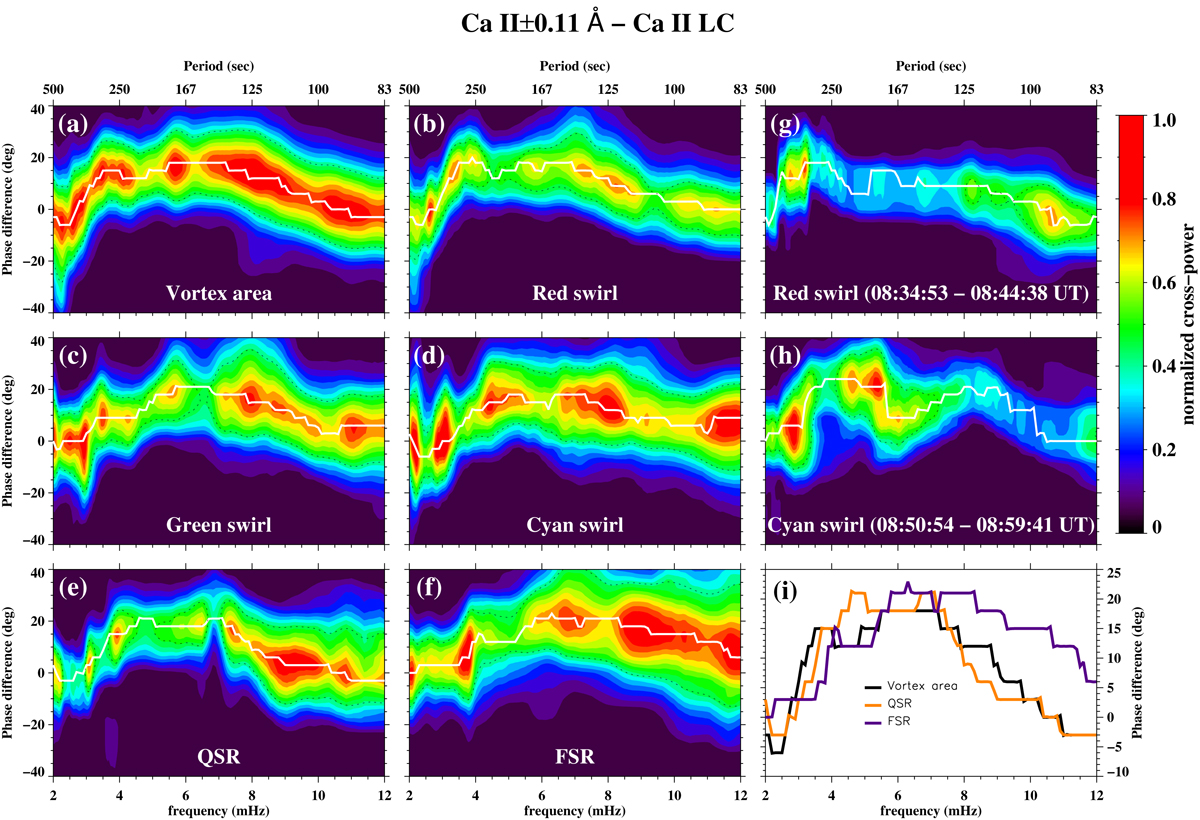
Similarly to Fig. 2 halftone images for the Ca II ± 0.11 Å and the Ca II LC pair of the Ca II 8542 Å line. In the bottom right panel, only the corresponding curves for the vortex area, the QSR and the FSR are shown as curves for respective individual swirl areas are quite similar to these (see text).
Current usage metrics show cumulative count of Article Views (full-text article views including HTML views, PDF and ePub downloads, according to the available data) and Abstracts Views on Vision4Press platform.
Data correspond to usage on the plateform after 2015. The current usage metrics is available 48-96 hours after online publication and is updated daily on week days.
Initial download of the metrics may take a while.