Fig. 7.
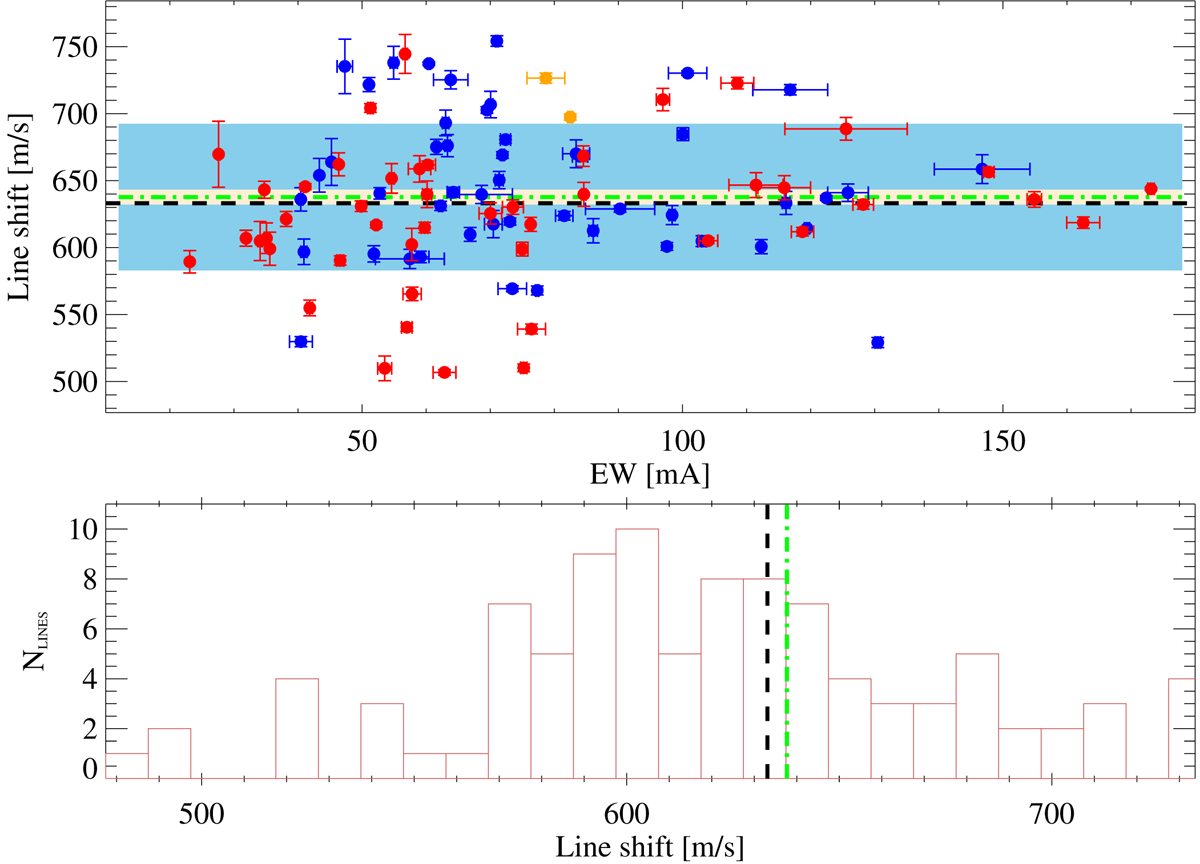
Top panel: line shift from Fe I spectral lines, estimated using the recalibrated wavelengths, λnist, as reference laboratory wavelengths, fitted on HARPS-LFC Moon spectra with 3D line profiles in the blue chip (blue dots) and in the red chip (red dots). Line shifts of the two Fe II lines are displayed as orange symbols. The light blue and light yellow regions show the standard deviation, σGRS, 3D, and the ![]() . Bottom panel: histogram of the line shifts. The black dashed line shows the theoretical solar GRS. The green dashed-dotted line shows the mean line shift, vGRS, 3D, of N = 97 lines at 10 < EW [mÅ] < 180.
. Bottom panel: histogram of the line shifts. The black dashed line shows the theoretical solar GRS. The green dashed-dotted line shows the mean line shift, vGRS, 3D, of N = 97 lines at 10 < EW [mÅ] < 180.
Current usage metrics show cumulative count of Article Views (full-text article views including HTML views, PDF and ePub downloads, according to the available data) and Abstracts Views on Vision4Press platform.
Data correspond to usage on the plateform after 2015. The current usage metrics is available 48-96 hours after online publication and is updated daily on week days.
Initial download of the metrics may take a while.