Fig. 4.
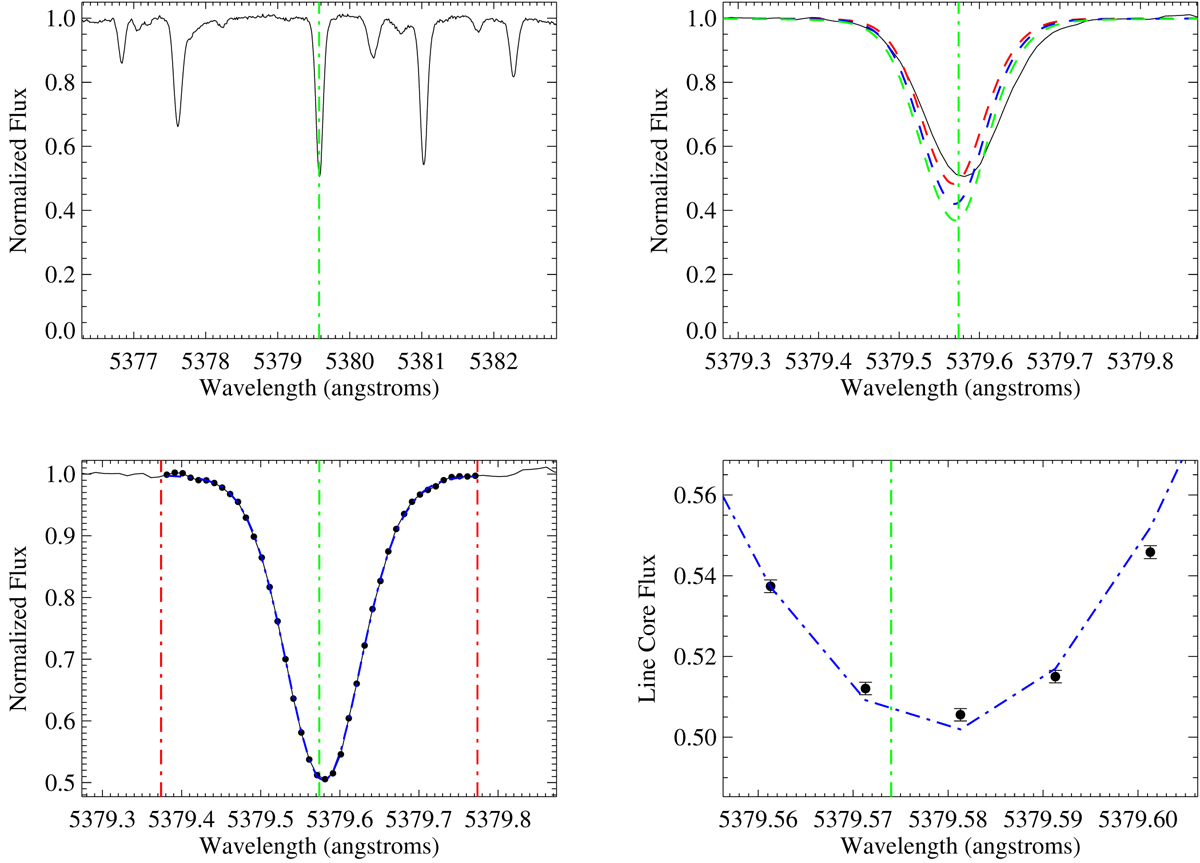
Example of global line fit of the line Fe Iλlab 5379.5740 Å described in Sect. 5. Top-left panel: normalised flux of a HARPS-LFC spectrum (black thin line) of the Moon, labelled s429 in Table 1, centred on λlab = 5379.5740 Å as a vertical green dashed-dotted line. Top-right panel: observed line profile together with unbroadened 3D line profiles of three different strengths. Bottom-left panel: global line fit (blue dashed-dotted line) to the line flux points within the spectral region of 0.4 Å (region within the vertical red dashed-dotted lines) centred on the laboratory wavelength (vertical green dashed-dotted line). Bottom-right panel: line core flux points (black dots) and global line fit (blue dashed-dotted line) with the laboratory wavelength (vertical green dashed-dotted line) shown as reference.
Current usage metrics show cumulative count of Article Views (full-text article views including HTML views, PDF and ePub downloads, according to the available data) and Abstracts Views on Vision4Press platform.
Data correspond to usage on the plateform after 2015. The current usage metrics is available 48-96 hours after online publication and is updated daily on week days.
Initial download of the metrics may take a while.