Fig. 3.
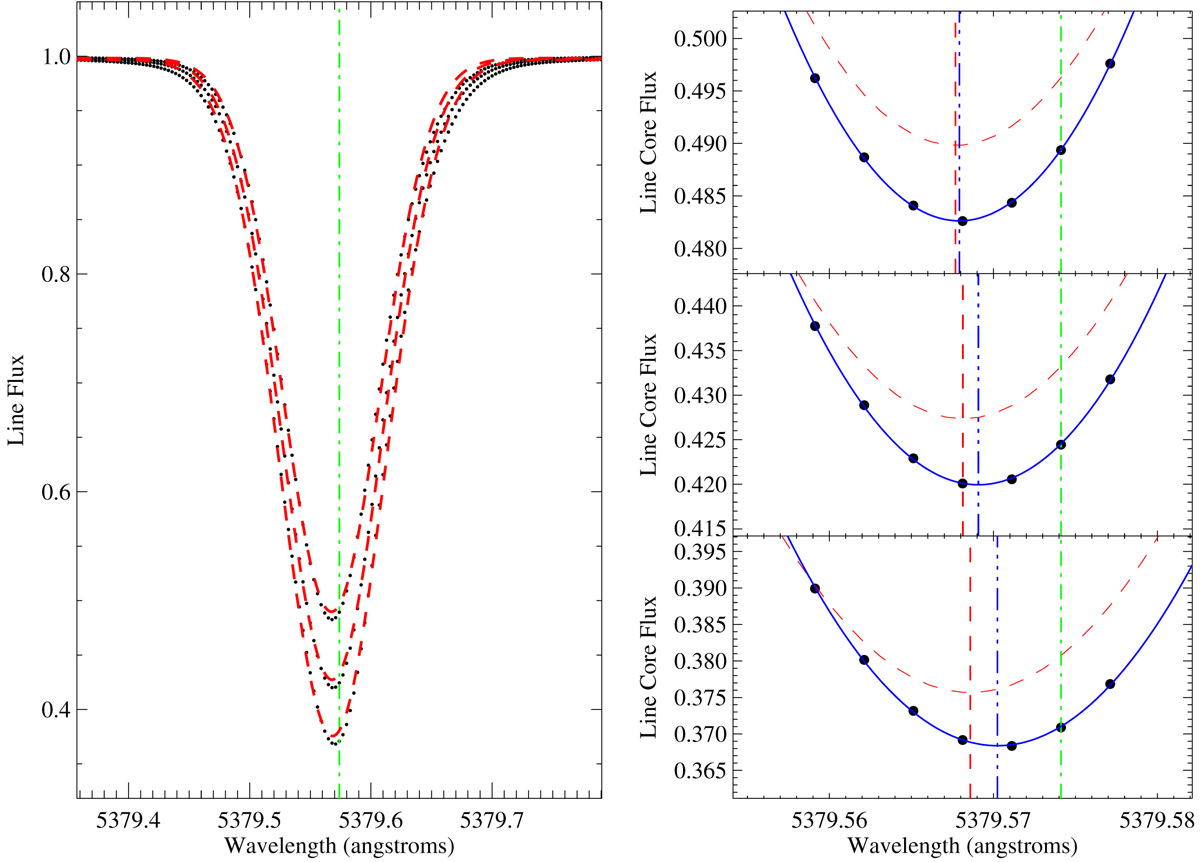
Example of line core fit of the 3D profiles of the line Fe Iλlab 5379.5740 Å described in Sect. 4. Left panel: line 3D profiles for three line strengths at solar abundance ±0.1 dex (black dots) together with single Gaussian fits (red dashed lines) and the laboratory wavelength (vertical green dashed-dotted line). Right panels: parabolic fits (blue solid line) to the line core of the three 3D profiles, together with single Gaussian fits (red dashed lines). Vertical lines show the wavelength position of the centroids of the parabolic fit (blue dashed-three dotted line) and the Gaussian fit (red dashed line), together with the laboratory wavelength (vertical green dashed-dotted line).
Current usage metrics show cumulative count of Article Views (full-text article views including HTML views, PDF and ePub downloads, according to the available data) and Abstracts Views on Vision4Press platform.
Data correspond to usage on the plateform after 2015. The current usage metrics is available 48-96 hours after online publication and is updated daily on week days.
Initial download of the metrics may take a while.