Fig. 1.
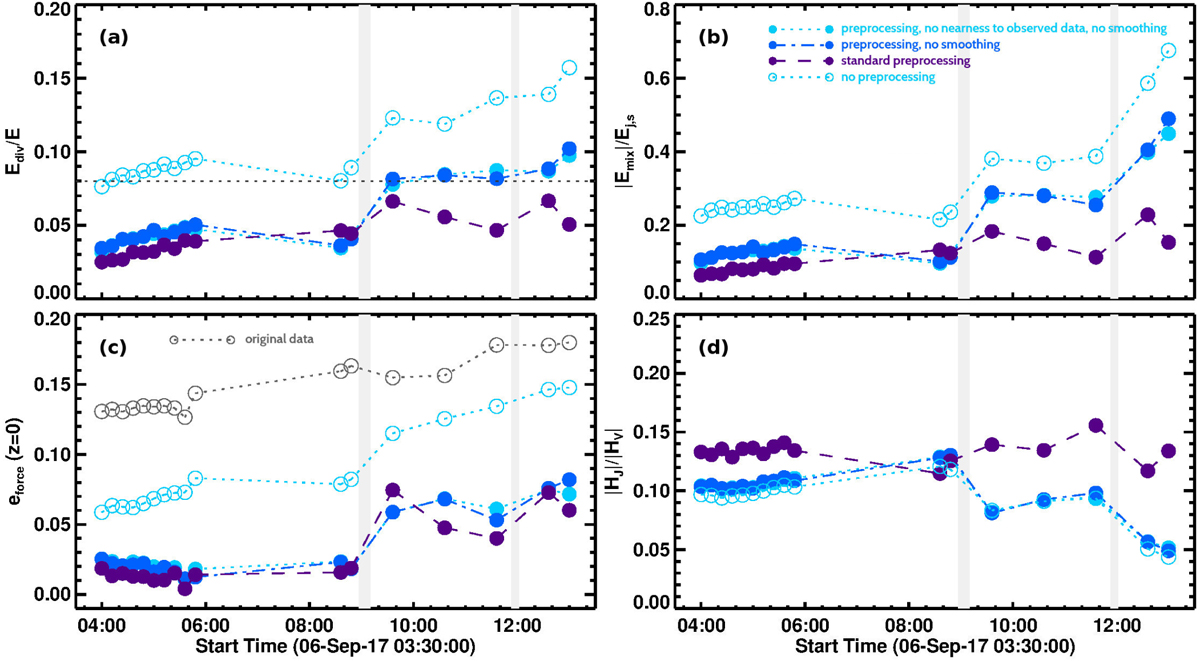
Evolution of (a) Ediv/E and (b) |Emix|/EJ, s and (c) ϵforce for different NLFF models based on different input data: not preprocessed (light blue circles), standard preprocessed (violet bullets), preprocessed without smoothing (dark blue bullets), preprocessed without smoothing and no nearness to observed data enforced (light blue bullets). (d) Corresponding time evolution of |HJ|/|H𝒱|. The horizontal dashed line in (a) indicates the nominal threshold of Ediv/E = 0.08, an upper limit for the accepted solenoidality of the input magnetic field. The vertical bars show the time span between the nominal GOES start and peak time of the X2.2 (peak time 08:57 UT) and X9.3 flare (peak time 11:53 UT).
Current usage metrics show cumulative count of Article Views (full-text article views including HTML views, PDF and ePub downloads, according to the available data) and Abstracts Views on Vision4Press platform.
Data correspond to usage on the plateform after 2015. The current usage metrics is available 48-96 hours after online publication and is updated daily on week days.
Initial download of the metrics may take a while.