Fig. 8.
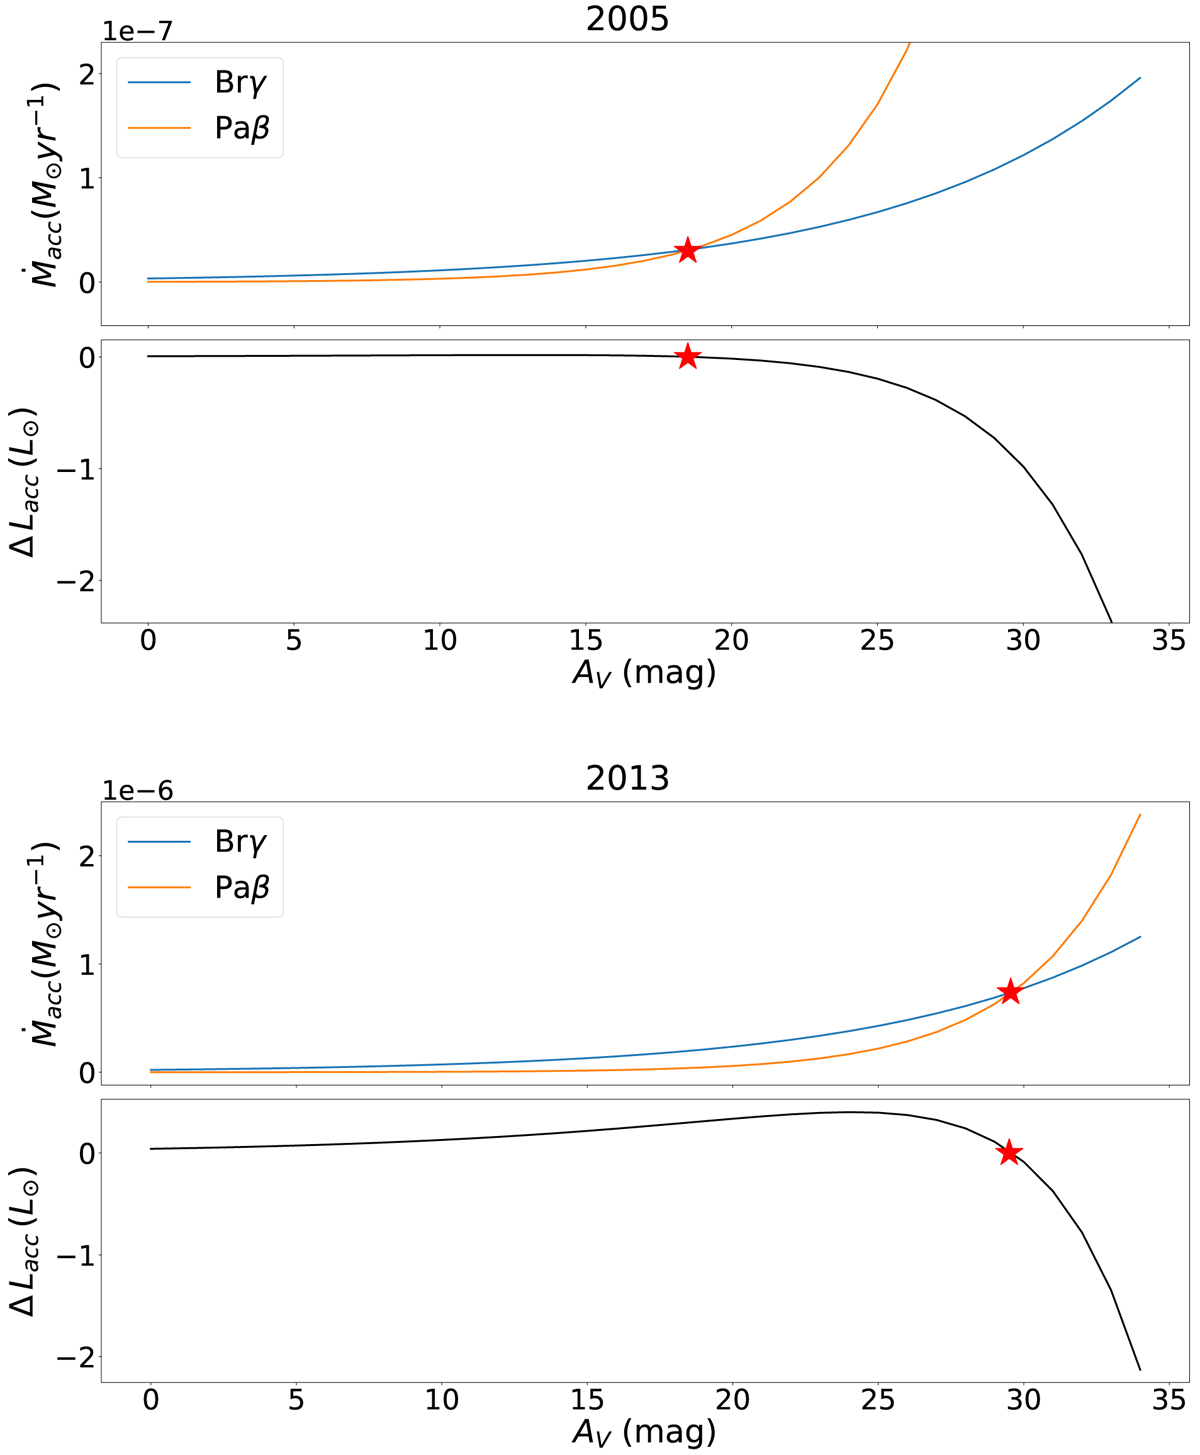
Ṁacc and ΔLacc vs. AV for the 2005 (top panel) and 2013 (bottom panel) epochs. The blue line represents the measurement of Ṁacc using the Brγ line luminosity and the orange line represents the measurement of Ṁacc using the Paβ line luminosity. The red stars represent the value of AV where the Brγ and Paβ de-reddened fluxes best agree in calculating the Ṁacc.
Current usage metrics show cumulative count of Article Views (full-text article views including HTML views, PDF and ePub downloads, according to the available data) and Abstracts Views on Vision4Press platform.
Data correspond to usage on the plateform after 2015. The current usage metrics is available 48-96 hours after online publication and is updated daily on week days.
Initial download of the metrics may take a while.