Fig. 6.
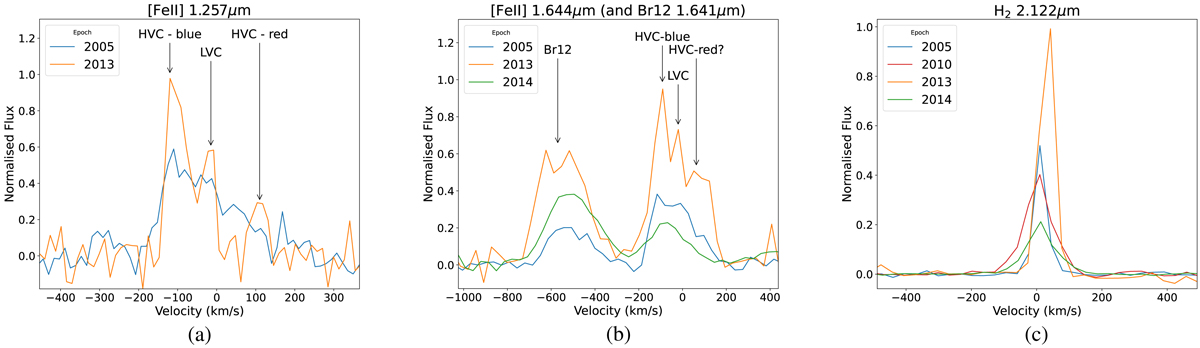
Panels a and b: line profiles of [Fe II] at 1.257 μm and 1.644 μm. Panel c: line profile of molecular hydrogen (H2) 2.122 μm. All lines are continuum-subtracted and have been corrected to the cloud velocity. In (b) and (c), the ISAAC spectral data (epochs 2005 and 2013) have been smoothed to match the lower spectral resolution of the SINFONI data (epoch 2014); in (a), this was not necessary as only ISAAC data contained J band observations. We note the different velocity components present. The redshifted HVC in (b) cannot be separated as it is blended with the LVC. In (b) the Br12 (1.641 μm) line is also shown to highlight how the 2014 epoch (green line) changes differently in the outflow-tracing [Fe II] emission from the accretion-tracing Br12 line.
Current usage metrics show cumulative count of Article Views (full-text article views including HTML views, PDF and ePub downloads, according to the available data) and Abstracts Views on Vision4Press platform.
Data correspond to usage on the plateform after 2015. The current usage metrics is available 48-96 hours after online publication and is updated daily on week days.
Initial download of the metrics may take a while.