Fig. 5.
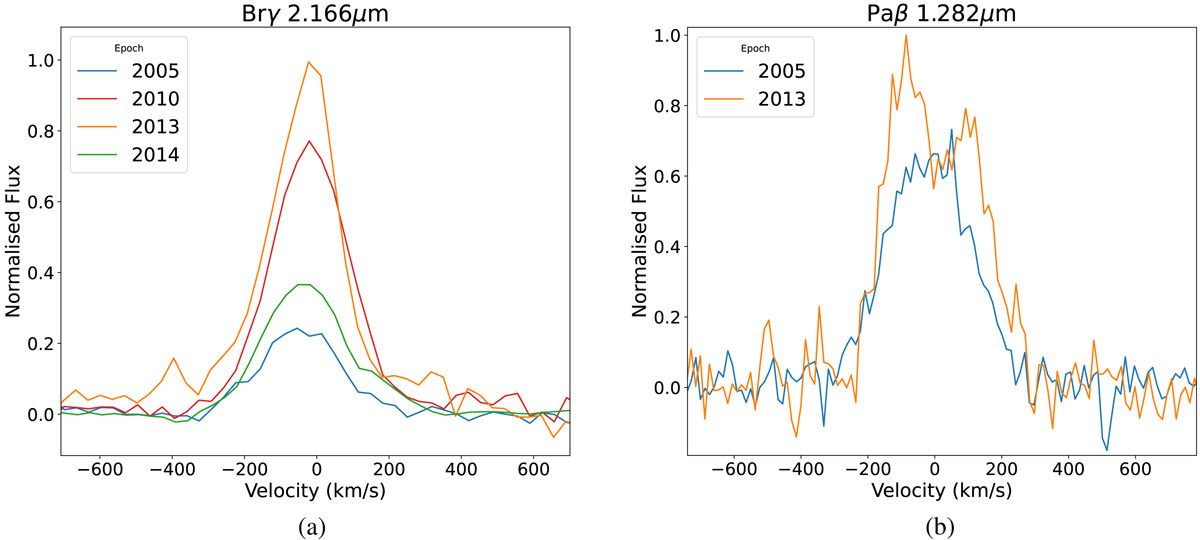
Line profiles of the (panel a) Brγ 2.166 μm and (panel b) Paβ 1.282 μm hydrogen-recombination lines. Both lines are continuum-subtracted and have been corrected to the cloud velocity and normalised to the 2013 peak flux densities. In (a), the ISAAC spectral data (epochs 2005 and 2013) have been smoothed to match the lower spectral resolution of the SINFONI data (epoch 2014). In (b), this was not necessary as only ISAAC data contained J band observations.
Current usage metrics show cumulative count of Article Views (full-text article views including HTML views, PDF and ePub downloads, according to the available data) and Abstracts Views on Vision4Press platform.
Data correspond to usage on the plateform after 2015. The current usage metrics is available 48-96 hours after online publication and is updated daily on week days.
Initial download of the metrics may take a while.